Overall system
—
Needs CPU and GPU
PC Builder
Compatibility filters are applied automatically. Scores stay on the server; changing a part updates this page without a full reload.
Start with performance
Select a CPU first. Only motherboards for that socket will unlock.
Select a motherboard first. Only RAM of that memory type will unlock.
Complete the system
Selected NVMe SSD: Patriot P410 1TB
Price on Amazon: $165
Capacity / Endurance: 1000 GB / 320 TBW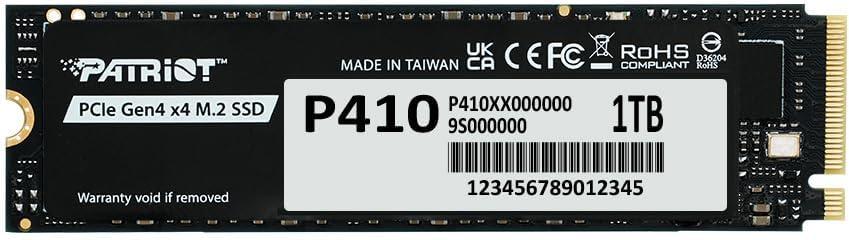
Select a motherboard first. Only cases that fit that form factor will unlock.
Select a CPU and a PC case first. Coolers are filtered by socket and case clearance.
Select a PC case first. Power supplies are then filtered by case PSU size and estimated wattage.
Live build report
System snapshot
Scores are relative estimates on a 0–100 scale. They are most useful for comparing complete builds on PCSpecChart.
Needs CPU and GPU
Performance per price
Projected productivity
Needs CPU and GPU
A direct view of performance, value, productivity, and gaming balance.
Select a CPU and GPU to generate a system profile.
Component breakdown
Compare each selected part with the best-performing hardware in the database, then check how much performance each dollar buys.
Capability compared with the current category leader.
Select components above to populate this chart.
Category-adjusted value using the latest recorded price. Hover a bar for the price and score meaning.
Select priced components above to compare value.
Performance projection
How each selected component affects projected application and 1080p gaming performance.
| PC part | Selected part | Application | Gaming 1080p |
|---|---|---|---|
| Total | CPU/GPU average 0.0% | % | 0.0% |
Methodology and limits
The builder combines compatibility rules, normalized component data, current recorded prices, and system-level interaction estimates. It is a comparison and planning tool—not a substitute for a vendor compatibility list or an application-specific benchmark.
Each selection narrows the components that follow using recorded sockets, memory type, form factor, clearances, cooling support, PSU format, and estimated power.
CPU, motherboard VRM, RAM, GPU, and resolution are evaluated together instead of treating every component as an isolated score.
The report estimates application performance, realized gaming performance at three resolutions, component quality, total price, and power needs.
Performance-per-price scores use the latest recorded price and category-specific normalization so value can be compared within the database.
Scores are normalized against PCSpecChart reference data. A 100% score is a comparison baseline, not a claim that the part has reached a theoretical hardware limit. Some category-table scores can exceed 100% when hardware outperforms the original reference.
The exact reference hardware and normalization constants may change as the database and benchmark sources are updated.
The CPU application score is the starting point. The selected motherboard’s recorded VRM capability can reduce or slightly improve the projection, while RAM speed and latency apply a separate memory-performance adjustment.
This describes broad system potential. The effect in a specific application can be smaller or larger depending on its CPU, memory, and storage behavior.
The GPU’s resolution-specific score is adjusted by the selected CPU and RAM. CPU limits matter most at 1080p and progressively less at 1440p and 4K, where the GPU is more likely to be the limiting component.
The result is a relative estimate for comparing builds; it is not an FPS prediction for an individual game.
The overall score begins with the average of projected CPU application performance and realized 1080p GPU performance. When a fully scored SSD is selected, storage performance applies a smaller adjustment to that result.
This headline score is useful for comparing PCSpecChart builds; application and resolution-specific scores remain better for evaluating a particular workload.
Total price is the sum of selected products using their latest recorded Amazon prices. Whole-build value is a price-weighted blend of the available component value scores, so incomplete price or specification data can affect the result.
Estimated PSU demand starts with a 50 W system allowance, adds CPU maximum power and 110% of GPU rated power, then adds 15% headroom. The PSU list is filtered above that estimate.
The builder checks the compatibility data recorded in the database, including the main socket, memory, case, cooler, GPU-length, PSU-format, and power relationships.
It cannot guarantee BIOS support, vendor QVL approval, every cable or connector, RAM-and-cooler interference, radiator placement conflicts, or tolerances missing from manufacturer specifications.