Message


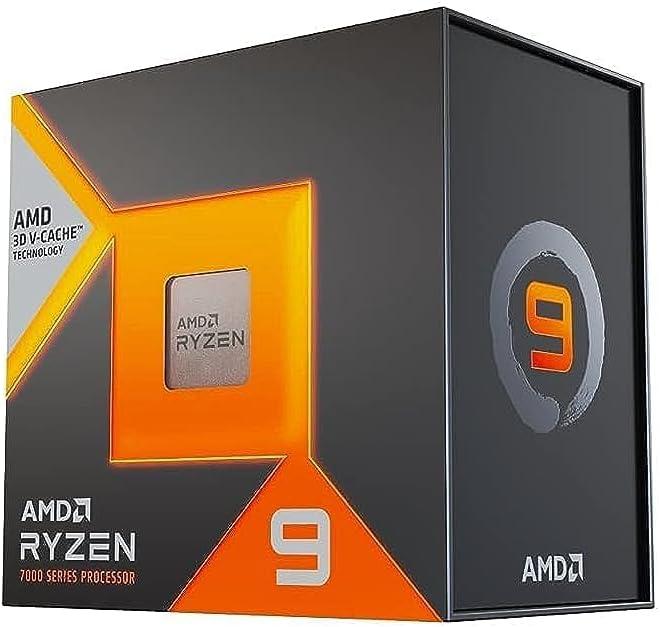
AMD Ryzen 9 7900X3D


AMD Ryzen 9 7900X3D Specifications and Performance Analysis

The AMD Ryzen 9 7900X3D is based on the Raphael architecture and is manufactured using the 5 nm process at the TSMC foundry. It is compatible with the AM5 socket used by X670E, X670, B650E, B650, A620 chipsets and supports PCIe Gen 5, 24 Lanes (CPU only), as well as DDR5 memory with speeds of up to 5200 MT/s across Dual-channel memory. This processor features 12 cores operating at a base clock of 4.40 GHz and a boost clock of up to 5.60 GHz, for a total of 24 threads. It is equipped with 64 kB of L1 cache, 1024 kB of L2 cache, and 128 MB of L3 cache.

This CPU is designed for a mainstream desktop platform. It supports consumer-grade memory configurations and modern expansion standards, making it suitable for everyday computing, gaming, and productivity workloads.

The AMD Ryzen 9 7900X3D has a base TDP of 120 W and a moderate maximum TDP of 162 W. Most mid-range aftermarket air coolers are sufficient for thermal control. This processor is also suitable for small form factor builds, which often have limited airflow.

For users who require integrated graphics, this CPU includes the Radeon Graphics, which features 2 GPU cores. It operates at a base clock of 400.00 GHz and boosts up to 2200.00 GHz. This makes it suitable for systems without a dedicated GPU, capable of handling everyday tasks and running older or less demanding games. Integrated graphics can also accelerate specific workloads even when a discrete GPU is installed.

Application Performance

AMD Ryzen 9 7900X3D is an upper mid-range CPU, achieving a relative application performance score of 68.00% of the best possible desktop CPU performance. This CPU is ideal for multitasking and can handle professional applications such as 3D rendering, video editing, and other heavy workloads, though not at the same speed or efficiency as higher-end models.

The application performance-per-price ratio of AMD Ryzen 9 7900X3D is 29.1%, indicating lower value in this category. This CPU does not offer high application performance and has a low performance-to-price ratio, making it a poor value proposition. Better alternatives exist at this price point.

Gaming Performance

AMD Ryzen 9 7900X3D is a strong gaming CPU, achieving a relative gaming performance score at 1080p resolution of 82.25% compared to the best possible desktop CPU gaming performance. This CPU This CPU delivers excellent gaming performance, especially at higher resolutions where the GPU becomes the primary bottleneck. It is recommended for users who work on their computers but also engage in occasional or regular gaming.

The gaming performance-per-price score of 23.1%, this CPU does not offer strong value in this category. However, since it is a high-end gaming CPU offering top-tier performance, it remains a recommended choice for users who prioritize gaming power and are less concerned about budget constraints.


General Information

CPU Name AMD Ryzen 9 7900X3D
Release Price $599.00
Current Price on Amazon $700
Amazon Price Updated 47 minutes ago.
Launch Date 3 years, 6 months ago.
CPU Available True

Architecture

Architecture Raphael
Foundry TSMC
Process 5 nm
Socket AM5
Chipsets X670E, X670, B650E, B650, A620
Transistors 17840 million
Die Size 2x 71 mm²
PCIe Version Gen 5, 24 Lanes (CPU only)

Core Configuration

Cores / Threads 12 / 24
Base / Boost Clock 4.40 GHz / 5.60 GHz

RAM Support

Memory Support / Max Speed DDR5 / 5200 MT/s
Memory Bandwidth 83.2 GB/s
Memory Channels Dual-channel
ECC Support True

Cache Configuration

L1 Cache (per core) 64 kB
L2 Cache (per core) 1024 kB
L3 Cache (shared) 128 MB

TDP Configuration

Base TDP 120 W
Max Turbo Power 162 W

Integrated Graphics

Integrated Graphics True
GPU Name Radeon Graphics
GPU Cores 2
GPU Base / Boost Clock 400.00 GHz / 2200.00 GHz

Cinebench R24 Performance

Cinebench R24 Multi-core1596
Cinebench R24 Single-core122

CPU Normalized Performance Chart

AMD Ryzen 9 7900X3D Compared to Similar Performance CPUs

CPU Price / Performance Table

CPU (Desc) Price (Desc) Performance (Desc) Game_Perf (Desc) Combined (Desc) Perf/Price (Desc) Game/Price (Desc) Combined/Price (Desc)
Intel Core Ultra 5 250KF Plus
$200 | ↑ 0.0%
68.8%
81.2%
75.0%
103.2%
80.0%
93.7%
Intel Core Ultra 5 250K Plus
$220 | 0.0%
68.8%
81.2%
75.0%
93.8%
72.7%
85.2%
Intel Core i9-13900
$640 | ↑ 11.1%
68.0%
81.0%
74.5%
31.9%
24.9%
29.1%
Intel Core i9-13900F
$400 | 0.0%
68.0%
81.0%
74.5%
51.0%
39.9%
46.6%
AMD Ryzen 9 7900X3D
$700 | 0.0%
68.0%
82.3%
75.1%
29.1%
23.1%
26.8%
Intel Core i7-13700KF
$379 | 0.0%
66.4%
80.6%
73.5%
52.6%
41.9%
48.5%
Intel Core i7-13700K
$400 | ↓ -11.1%
66.4%
80.6%
73.5%
49.8%
39.7%
45.9%
Intel Core i7-14700F
$290 | ↑ 3.6%
65.6%
81.1%
73.3%
67.8%
55.1%
63.2%
Intel Core i7-14700
$379 | 0.0%
65.6%
81.1%
73.3%
51.9%
42.1%
48.3%

Processor Comparison and Detail Specifications Table

Specification
Intel Core Ultra 5 250KF Plus
Intel Core Ultra 5 250K Plus
Intel Core i9-13900
Intel Core i9-13900
Intel Core i9-13900F
AMD Ryzen 9 7900X3D
AMD Ryzen 9 7900X3D
Intel Core i7-13700KF
Intel Core i7-13700K
Intel Core i7-14700F
Intel Core i7-14700
Intel Core i7-14700
Perf Chart
Price
$200 | ↑ 0.0%
$220 | 0.0%
$640 | ↑ 11.1%
$400 | 0.0%
$700 | 0.0%
$379 | 0.0%
$400 | ↓ -11.1%
$290 | ↑ 3.6%
$379 | 0.0%
Manufacturer Intel Intel Intel Intel AMD Intel Intel Intel Intel
C/SC/T 18 / 12 / 18 18 / 12 / 18 24 / 16 / 32 24 / 16 / 32 12 / 0 / 24 16 / 8 / 24 16 / 8 / 24 20 / 12 / 28 20 / 12 / 28
L2 / L3 Cache 3072.0 kB / 30.0 MB 3072.0 kB / 30.0 MB 2048.0 kB / 36.0 MB 2048.0 kB / 36.0 MB 1024.0 kB / 128.0 MB 2048.0 kB / 30.0 MB 2048.0 kB / 30.0 MB 2048.0 kB / 33.0 MB 2048.0 kB / 33.0 MB
Base / Boost 4.20 GHz / 5.30 GHz 4.20 GHz / 5.30 GHz 2.00 GHz / 5.60 GHz 2.00 GHz / 5.60 GHz 4.40 GHz / 5.60 GHz 3.40 GHz / 5.40 GHz 3.40 GHz / 5.40 GHz 2.10 GHz / 5.40 GHz 2.10 GHz / 5.40 GHz
Memory DDR5 / 7200 MT/s DDR5 / 7200 MT/s DDR4, DDR5 / 5600 MT/s DDR4, DDR5 / 5600 MT/s DDR5 / 5200 MT/s DDR4, DDR5 / 5600 MT/s DDR4, DDR5 / 5600 MT/s DDR4, DDR5 / 5600 MT/s DDR4, DDR5 / 5600 MT/s
Arch / Node Arrow Lake Refresh / 3 nm Arrow Lake Refresh / 3 nm Raptor Lake-S / 10 nm Raptor Lake-S / 10 nm Raphael / 5 nm Raptor Lake-S / 10 nm Raptor Lake-S / 10 nm Raptor Lake-R / 10 nm Raptor Lake-R / 10 nm
TDP / Max 125 W / 159 W 125 W / 159 W 65 W / 219 W 65 W / 219 W 120 W / 162 W 125 W / 253 W 125 W / 253 W 65 W / 219 W 65 W / 219 W
Socket LGA 1851 LGA 1851 LGA 1700 LGA 1700 AM5 LGA 1700 LGA 1700 LGA 1700 LGA 1700
Int. GPU None Arc Xe-LPG Graphics 64EU UHD Graphics 770 None Radeon Graphics None UHD Graphics 770 None UHD Graphics 770

CPU Performance in Rendering, Encoding and Compression-Decompression

CPU (Desc) CB24_MC (Desc) CB24_SC (Desc) CB24_rel (Desc) Blender (Desc) Encoding_AV1 (Desc) Encoding_h265 (Desc) 7-zip_Pack (Desc) 7-zip_Unpack (Desc) Performance (Desc)
Intel Core Ultra 5 250KF Plus
1853 139
73.3%
70.3%
77.7%
70.4%
67.3%
53.7%
68.8%
Intel Core Ultra 5 250K Plus
1853 139
73.3%
70.3%
77.7%
70.4%
67.3%
53.7%
68.8%
Intel Core i9-13900
1790 128
70.8%
63.9%
70.2%
73.5%
66.8%
62.9%
68.0%
Intel Core i9-13900F
1790 128
70.8%
63.9%
70.2%
73.5%
66.8%
62.9%
68.0%
AMD Ryzen 9 7900X3D
1596 122
63.1%
61.1%
73.4%
67.2%
75.0%
68.0%
68.0%
Intel Core i7-13700KF
1657 125
65.6%
61.2%
72.3%
72.0%
69.1%
58.2%
66.4%
Intel Core i7-13700K
1657 125
65.6%
61.2%
72.3%
72.0%
69.1%
58.2%
66.4%
Intel Core i7-14700F
1750 126
69.2%
61.7%
69.1%
71.8%
65.0%
56.5%
65.6%
Intel Core i7-14700
1750 126
69.2%
61.7%
69.1%
71.8%
65.0%
56.5%
65.6%


Add Comment on AMD Ryzen 9 7900X3D