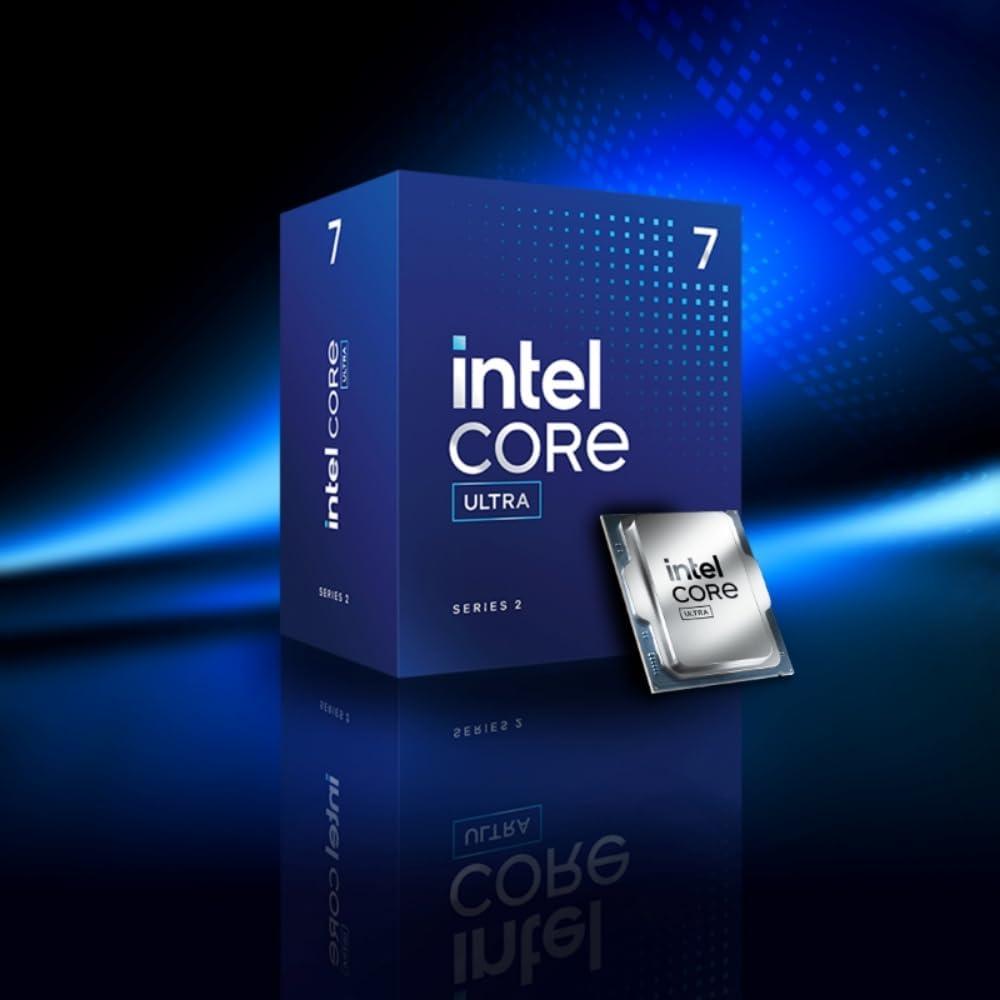
Intel Core Ultra 7 265F
Intel Core Ultra 7 265F Specifications and Performance Analysis
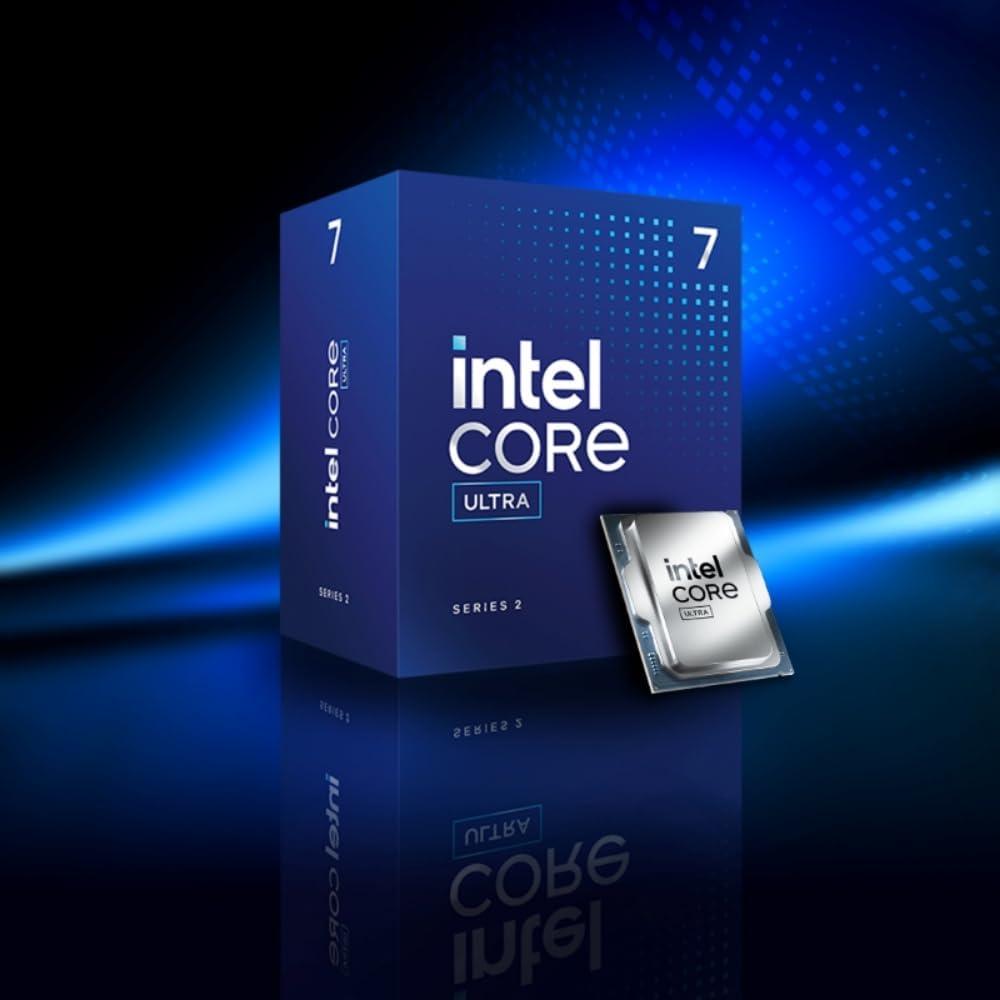
The Intel Core Ultra 7 265F is based on the Arrow Lake-S architecture and is manufactured using the 3 nm process at the TSMC foundry. It is compatible with the LGA 1851 socket used by Z890, B860, W880, Q870, H810 chipsets and supports PCIe Gen 5, 20 Lanes (CPU only), as well as DDR5 memory with speeds of up to 6400 MT/s across Dual-channel memory. This processor features a hybrid core configuration with 8 performance cores operating at a base clock of 2.40 GHz and boosting up to 5.30 GHz, alongside 12 efficiency cores running at a base clock of 1.80 GHz and boosting up to 4.60 GHz, for a total of 20 threads. It is equipped with 192 kB of L1 cache, 3072 kB of L2 cache, and 30 MB of L3 cache. The efficiency cores feature 96 kB of L1 cache and 4096 kB of L2 cache.
This CPU is designed for a mainstream desktop platform. It supports consumer-grade memory configurations and modern expansion standards, making it suitable for everyday computing, gaming, and productivity workloads.The Intel Core Ultra 7 265F has a base TDP of 65 W and a moderate maximum TDP of 182 W. Most mid-range aftermarket air coolers are sufficient for thermal control. This processor is also suitable for small form factor builds, which often have limited airflow.
This CPU does not include integrated graphics. A discrete graphics card is required for display output.
Application Performance
Intel Core Ultra 7 265F is an upper mid-range CPU, achieving a relative application performance score of 63.52% of the best possible desktop CPU performance. This CPU is ideal for multitasking and can handle professional applications such as 3D rendering, video editing, and other heavy workloads, though not at the same speed or efficiency as higher-end models.
Intel Core Ultra 7 265F delivers a balanced application performance-per-price ratio of 61.5%. It provides good value for users looking for a practical balance between cost and performance.
Gaming Performance
Intel Core Ultra 7 265F is a mid-range gaming CPU, achieving a relative gaming performance score at 1080p resolution of 79.17% compared to the best possible desktop CPU gaming performance. This CPU provides solid mid-level gaming, performance and is best paired with corresponding mid-range graphics cards. Note that CPU-related performance limitations decrease as GPU performance lowers—particularly at higher resolutions—since the GPU becomes the bottleneck.
The gaming performance-per-price ratio of Intel Core Ultra 7 265F is 50.3%. This places it in the mid-value category, making it suitable for average gaming builds aiming to strike a good balance between performance and cost.
General Information
| CPU Name | Intel Core Ultra 7 265F |
|---|---|
| Release Price | $379.00 |
| Current Price on Amazon | $310 |
| Amazon Price Updated | 56 minutes ago. |
| Launch Date | 1 year, 6 months ago. |
| CPU Available | True |
| Architecture | Arrow Lake-S |
|---|---|
| Foundry | TSMC |
| Process | 3 nm |
| Socket | LGA 1851 |
| Chipsets | Z890, B860, W880, Q870, H810 |
| Transistors | 17800 million |
| Die Size | 243 mm² |
| PCIe Version | Gen 5, 20 Lanes (CPU only) |
| Secondary PCIe | Gen 4, 4 Lanes |
| Cores / Threads | 20 / 20 |
|---|---|
| Performance Cores / Small Cores | 8 / 12 |
| Perf. Cores Base / Boost Clock | 2.40 GHz / 5.30 GHz |
| Small Cores Base / Boost Clock | 1.80 GHz / 4.60 GHz |
| Memory Support / Max Speed | DDR5 / 6400 MT/s |
|---|---|
| Memory Bandwidth | 102.4 GB/s |
| Memory Channels | Dual-channel |
| L1 Cache (per core) | 192 kB |
|---|---|
| L2 Cache (per core) | 3072 kB |
| L3 Cache (shared) | 30 MB |
| E-Core L1 Cache (per core) | 96 kB |
| E-Core L2 Cache (per module) | 4096 MB |
| Base TDP | 65 W |
|---|---|
| Max Turbo Power | 182 W |
| PL1 (Long Duration Power) | 65 W |
| Integrated Graphics | False |
|---|
Cinebench R24 Performance
| Cinebench R24 Multi-core | 1600 |
|---|---|
| Cinebench R24 Single-core | 133 |
CPU Normalized Performance Chart
Intel Core Ultra 7 265F Compared to Similar Performance CPUs
CPU Price / Performance Table
| CPU (Desc) | Price (Desc) | Performance (Desc) | Game_Perf (Desc) | Combined (Desc) | Perf/Price (Desc) | Game/Price (Desc) | Combined/Price (Desc) |
|---|---|---|---|---|---|---|---|
|
$290
|
↑
3.6%
|
65.6%
|
81.1%
|
73.3%
|
67.8%
|
55.1%
|
63.2%
|
|
|
$379
|
0.0%
|
65.6%
|
81.1%
|
73.3%
|
51.9%
|
42.1%
|
48.3%
|
|
|
$310❗
|
0.0%
|
64.2%
|
68.5%
|
66.4%
|
62.1%
|
43.6%
|
53.5%
|
|
|
$310
|
↓
-1.9%
|
63.5%
|
79.2%
|
71.3%
|
61.5%
|
50.3%
|
57.5%
|
|
|
$372
|
0.0%
|
63.5%
|
79.2%
|
71.3%
|
51.3%
|
42.0%
|
48.0%
|
|
|
$316
|
↓
0.0%
|
63.0%
|
76.4%
|
69.7%
|
59.8%
|
47.7%
|
55.2%
|
|
|
$430
|
0.0%
|
60.5%
|
76.2%
|
68.3%
|
42.2%
|
34.9%
|
39.7%
|
|
|
$344
|
0.0%
|
60.5%
|
76.2%
|
68.3%
|
52.7%
|
43.6%
|
49.7%
|
|
|
$484
|
0.0%
|
59.0%
|
100.0%
|
79.5%
|
36.6%
|
40.7%
|
41.1%
|
Processor Comparison and Detail Specifications Table
| Specification | Perf Chart | ||||||||
|---|---|---|---|---|---|---|---|---|---|
| Price |
$290
|
↑
3.6%
|
$379
|
0.0%
|
$310❗
|
0.0%
|
$310
|
↓
-1.9%
|
$372
|
0.0%
|
$316
|
↓
0.0%
|
$430
|
0.0%
|
$344
|
0.0%
|
$484
|
0.0%
|
| Manufacturer | Intel | Intel | AMD | Intel | Intel | AMD | Intel | Intel | AMD |
| C/SC/T | 20 / 12 / 28 | 20 / 12 / 28 | 16 / 0 / 32 | 20 / 12 / 20 | 20 / 12 / 20 | 12 / 0 / 24 | 16 / 8 / 24 | 16 / 8 / 24 | 8 / 0 / 16 |
| L2 / L3 Cache | 2048.0 kB / 33.0 MB | 2048.0 kB / 33.0 MB | 512.0 kB / 64.0 MB | 3072.0 kB / 30.0 MB | 3072.0 kB / 30.0 MB | 1024.0 kB / 64.0 MB | 1280.0 kB / 30.0 MB | 1280.0 kB / 30.0 MB | 1024.0 kB / 96.0 MB |
| Base / Boost | 2.10 GHz / 5.40 GHz | 2.10 GHz / 5.40 GHz | 3.40 GHz / 4.90 GHz | 2.40 GHz / 5.30 GHz | 2.40 GHz / 5.30 GHz | 3.70 GHz / 5.40 GHz | 3.20 GHz / 5.20 GHz | 3.20 GHz / 5.20 GHz | 4.70 GHz / 5.60 GHz |
| Memory | DDR4, DDR5 / 5600 MT/s | DDR4, DDR5 / 5600 MT/s | DDR4 / 3200 MT/s | DDR5 / 6400 MT/s | DDR5 / 6400 MT/s | DDR5 / 5200 MT/s | DDR4, DDR5 / 3200 MT/s | DDR4, DDR5 / 3200 MT/s | DDR5 / 5600 MT/s |
| Arch / Node | Raptor Lake-R / 10 nm | Raptor Lake-R / 10 nm | Vermeer / 7 nm | Arrow Lake-S / 3 nm | Arrow Lake-S / 3 nm | Raphael / 5 nm | Alder Lake-S / 10 nm | Alder Lake-S / 10 nm | Granite Ridge / 4 nm |
| TDP / Max | 65 W / 219 W | 65 W / 219 W | 105 W / 142 W | 65 W / 182 W | 65 W / 182 W | 65 W / 88 W | 125 W / 241 W | 125 W / 241 W | 120 W / 162 W |
| Socket | LGA 1700 | LGA 1700 | AM4 | LGA 1851 | LGA 1851 | AM5 | LGA 1700 | LGA 1700 | AM5 |
| Int. GPU | None | UHD Graphics 770 | None | None | Arc Xe-LPG Graphics 32EU | Radeon Graphics | UHD Graphics 770 | None | Radeon Graphics |
CPU Performance in Rendering, Encoding and Compression-Decompression
| CPU (Desc) | CB24_MC (Desc) | CB24_SC (Desc) | CB24_rel (Desc) | Blender (Desc) | Encoding_AV1 (Desc) | Encoding_h265 (Desc) | 7-zip_Pack (Desc) | 7-zip_Unpack (Desc) | Performance (Desc) |
|---|---|---|---|---|---|---|---|---|---|
| 1750 | 126 |
69.2%
|
61.7%
|
69.1%
|
71.8%
|
65.0%
|
56.5%
|
65.6%
|
|
| 1750 | 126 |
69.2%
|
61.7%
|
69.1%
|
71.8%
|
65.0%
|
56.5%
|
65.6%
|
|
| 1514 | 100 |
59.9%
|
54.8%
|
63.3%
|
66.4%
|
65.0%
|
75.9%
|
64.2%
|
|
| 1600 | 133 |
63.3%
|
66.3%
|
77.1%
|
71.8%
|
61.8%
|
40.8%
|
63.5%
|
|
| 1600 | 133 |
63.3%
|
66.3%
|
77.1%
|
71.8%
|
61.8%
|
40.8%
|
63.5%
|
|
| 1549 | 117 |
61.3%
|
53.6%
|
68.3%
|
62.8%
|
68.2%
|
63.6%
|
63.0%
|
|
| 1585 | 122 |
62.7%
|
56.5%
|
66.6%
|
66.7%
|
60.0%
|
50.3%
|
60.5%
|
|
| 1585 | 122 |
62.7%
|
56.5%
|
66.6%
|
66.7%
|
60.0%
|
50.3%
|
60.5%
|
|
| 1386 | 141 |
54.8%
|
52.0%
|
76.9%
|
58.4%
|
60.9%
|
51.0%
|
59.0%
|
Add Comment on Intel Core Ultra 7 265F