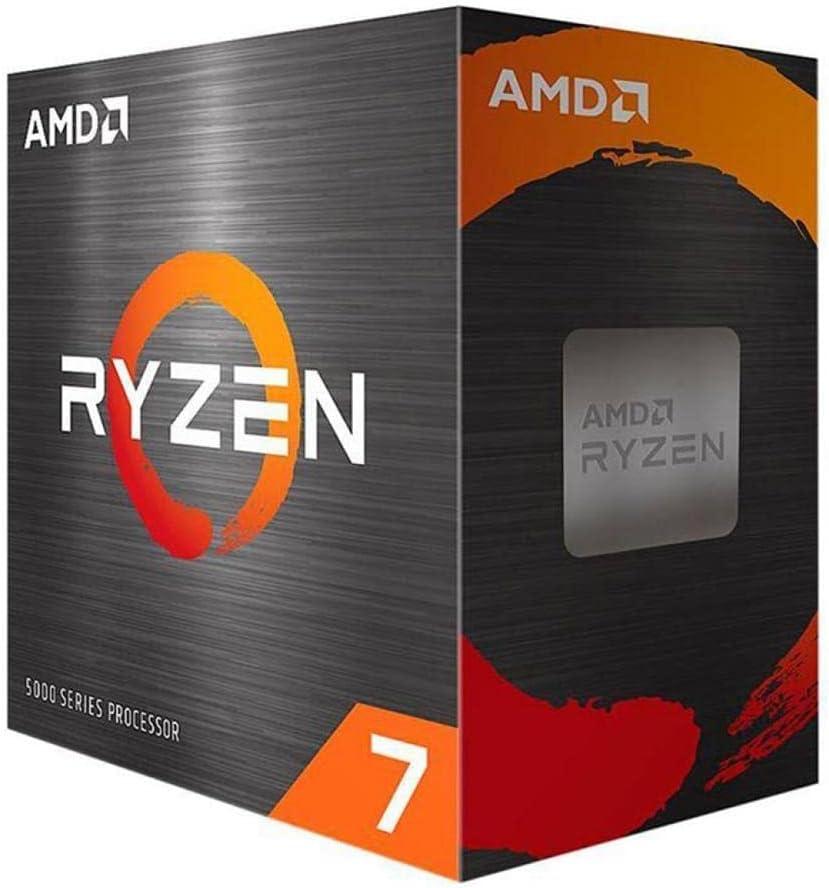
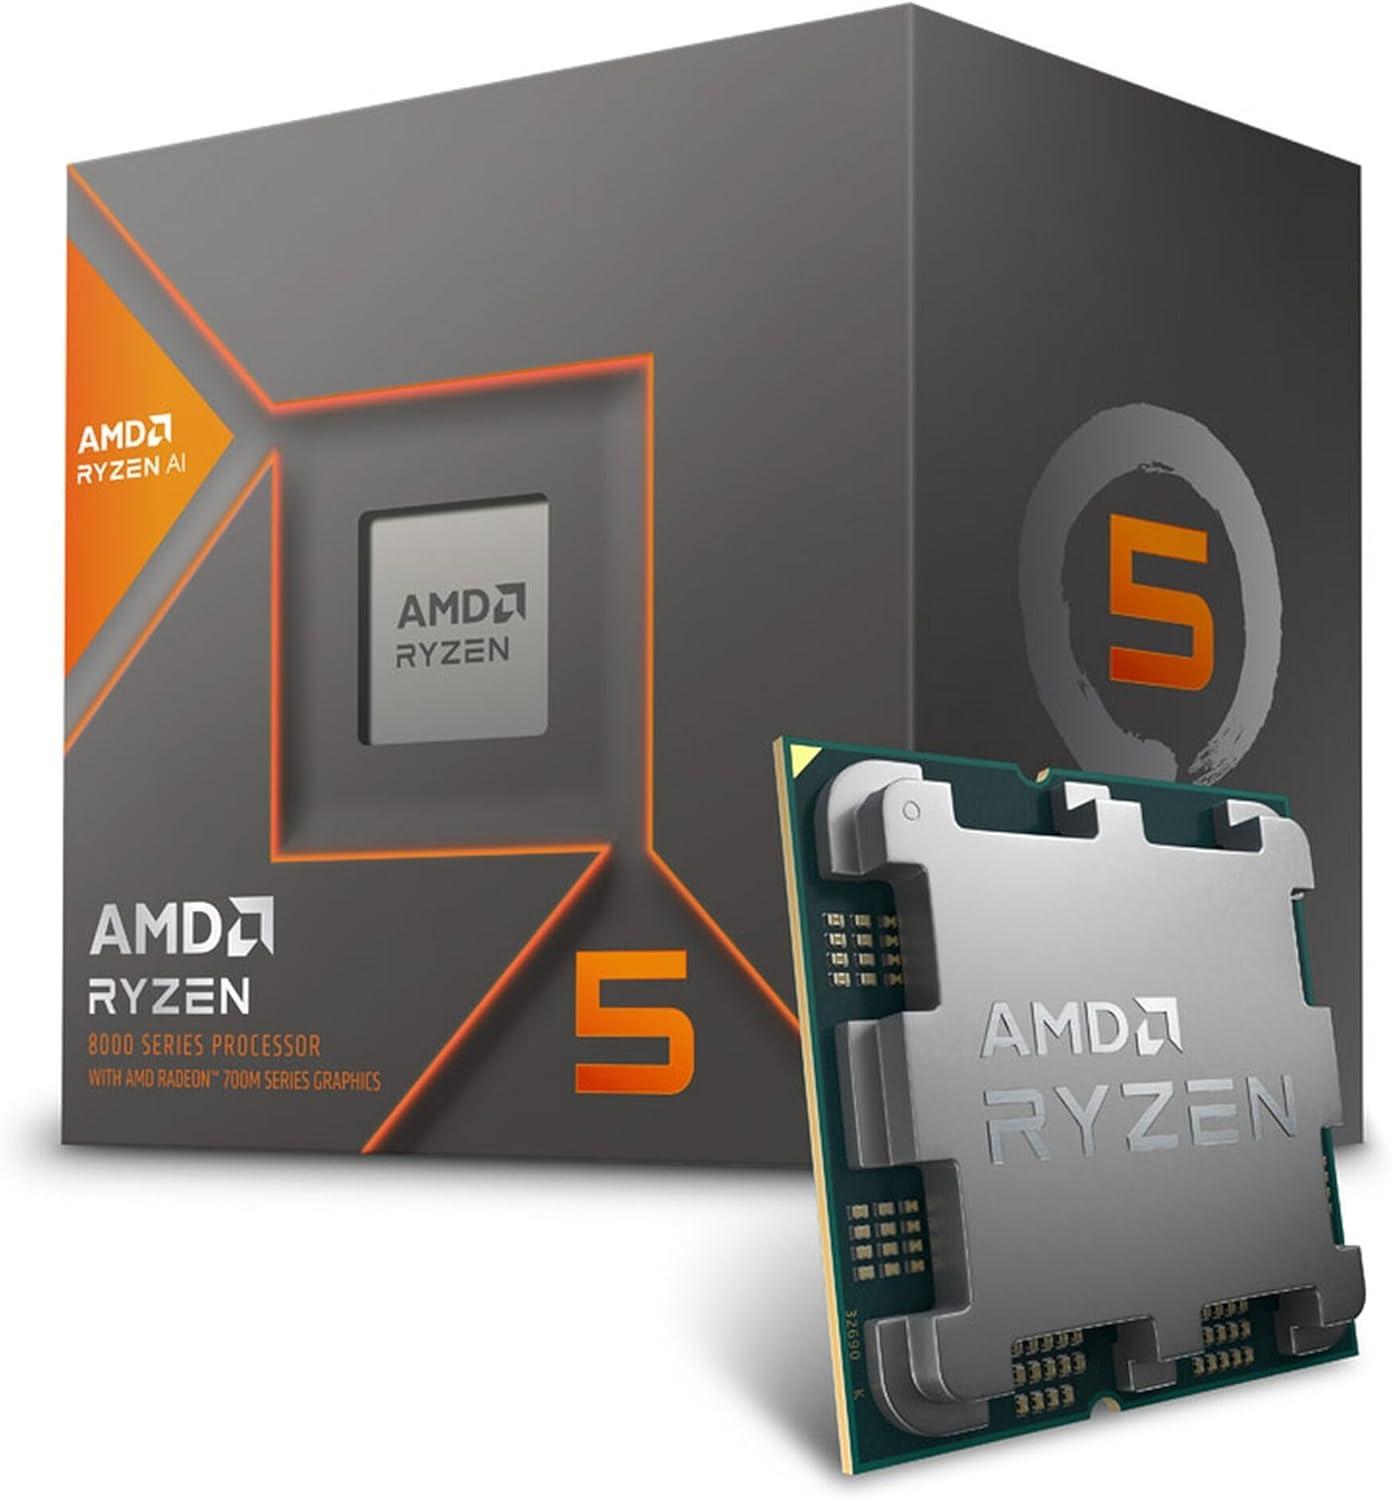
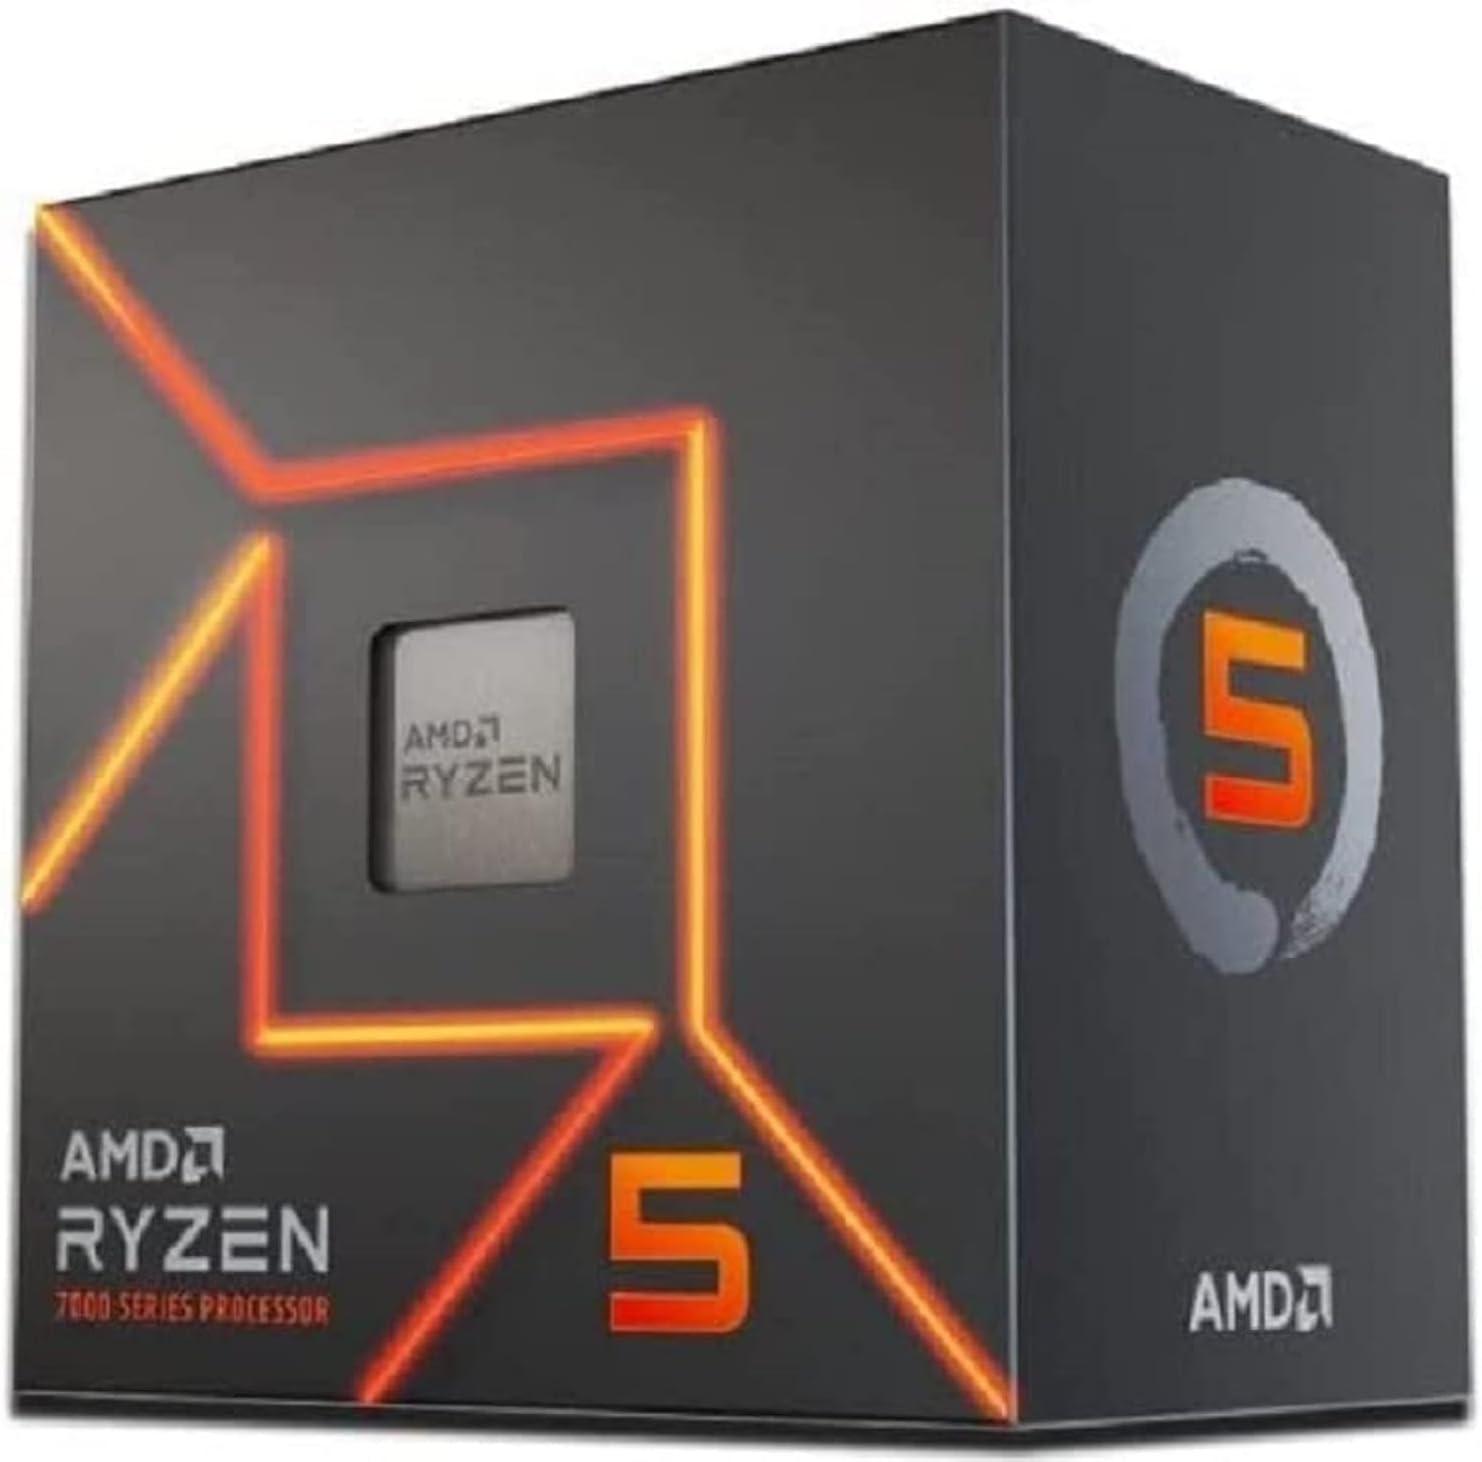
AMD Ryzen 5 7400F
AMD Ryzen 5 7400F Specifications and Performance Analysis
The AMD Ryzen 5 7400F is based on the Raphael architecture and is manufactured using the 5 nm process at the TSMC foundry. It is compatible with the AM5 socket used by X670E, X670, B650E, B650, A620, X870E, X870, B850, B840 chipsets and supports PCIe Gen 5, 24 Lanes (CPU only), as well as DDR5 memory with speeds of up to 5200 MT/s across Dual-channel memory. This processor features 6 cores operating at a base clock of 3.70 GHz and a boost clock of up to 4.70 GHz, for a total of 12 threads. It is equipped with 64 kB of L1 cache, 1024 kB of L2 cache, and 32 MB of L3 cache.
This CPU is designed for a mainstream desktop platform. It supports consumer-grade memory configurations and modern expansion standards, making it suitable for everyday computing, gaming, and productivity workloads.The AMD Ryzen 5 7400F has a low base TDP of 65 W and a maximum TDP of 88 W. Stock CPU coolers are generally adequate as long as overclocking is not applied. It is a good fit for compact systems where heat dissipation is a concern.
This CPU does not include integrated graphics. A discrete graphics card is required for display output.
Application Performance
AMD Ryzen 5 7400F is a budget CPU, achieving a relative application performance score of 34.93% of the best possible desktop CPU performance. Suitable for light multitasking such as web browsing, coding, and media consumption. Putting heavy workloads on these CPUs can lead to system freezes or unresponsive behavior over prolonged periods.
The application performance-per-price ratio of AMD Ryzen 5 7400F is 0.0%, indicating lower value in this category. This CPU does not offer high application performance and has a low performance-to-price ratio, making it a poor value proposition. Better alternatives exist at this price point.
Gaming Performance
AMD Ryzen 5 7400F is a mid-range gaming CPU, achieving a relative gaming performance score at 1080p resolution of 73.12% compared to the best possible desktop CPU gaming performance. This CPU provides solid mid-level gaming, performance and is best paired with corresponding mid-range graphics cards. Note that CPU-related performance limitations decrease as GPU performance lowers—particularly at higher resolutions—since the GPU becomes the bottleneck.
The gaming performance-per-price score of 0.0%, this CPU does not offer strong value in this category. As this CPU does not deliver top-tier gaming performance and also has a low gaming performance-to-price ratio, it represents poor value. More competitive options are available at a similar price point.
General Information
| CPU Name | AMD Ryzen 5 7400F |
|---|---|
| Release Price | $229.00 |
| Current Price on Amazon | $0 |
| Amazon Price Updated | No price update history available. |
| Launch Date | 1 year, 6 months ago. |
| CPU Available | False |
| Architecture | Raphael |
|---|---|
| Foundry | TSMC |
| Process | 5 nm |
| Socket | AM5 |
| Chipsets | X670E, X670, B650E, B650, A620, X870E, X870, B850, B840 |
| Transistors | 6570 million |
| Die Size | 71 mm² |
| PCIe Version | Gen 5, 24 Lanes (CPU only) |
| Cores / Threads | 6 / 12 |
|---|---|
| Base / Boost Clock | 3.70 GHz / 4.70 GHz |
| Memory Support / Max Speed | DDR5 / 5200 MT/s |
|---|---|
| Memory Bandwidth | 83.2 GB/s |
| Memory Channels | Dual-channel |
| ECC Support | True |
| L1 Cache (per core) | 64 kB |
|---|---|
| L2 Cache (per core) | 1024 kB |
| L3 Cache (shared) | 32 MB |
| Base TDP | 65 W |
|---|---|
| Max Turbo Power | 88 W |
| Integrated Graphics | False |
|---|
Cinebench R24 Performance
| Cinebench R24 Multi-core | 805 |
|---|---|
| Cinebench R24 Single-core | 108 |
CPU Normalized Performance Chart
AMD Ryzen 5 7400F Compared to Similar Performance CPUs
CPU Price / Performance Table
| CPU (Desc) | Price (Desc) | Performance (Desc) | Game_Perf (Desc) | Combined (Desc) | Perf/Price (Desc) | Game/Price (Desc) | Combined/Price (Desc) |
|---|---|---|---|---|---|---|---|
|
$188
|
0.0%
|
35.8%
|
63.7%
|
49.7%
|
57.2%
|
66.7%
|
66.2%
|
|
|
$205
|
0.0%
|
35.8%
|
52.8%
|
44.3%
|
52.4%
|
50.8%
|
54.1%
|
|
|
$387
|
↑
0.8%
|
35.0%
|
64.0%
|
49.5%
|
27.1%
|
32.6%
|
31.9%
|
|
|
$234
|
0.0%
|
35.0%
|
64.0%
|
49.5%
|
44.8%
|
53.8%
|
52.8%
|
|
|
$0
|
0.0%
|
34.9%
|
73.1%
|
54.0%
|
N/A | N/A | N/A | |
|
$149
|
0.0%
|
34.7%
|
62.3%
|
48.5%
|
69.9%
|
82.3%
|
81.3%
|
|
|
$205
|
0.0%
|
34.0%
|
52.0%
|
43.0%
|
49.8%
|
50.1%
|
52.5%
|
|
|
$268
|
0.0%
|
33.9%
|
63.7%
|
48.8%
|
38.0%
|
46.8%
|
45.5%
|
|
|
$210
|
0.0%
|
32.3%
|
62.5%
|
47.4%
|
46.1%
|
58.6%
|
56.4%
|
Processor Comparison and Detail Specifications Table
| Specification |
No image available |
Perf Chart | |||||||
|---|---|---|---|---|---|---|---|---|---|
| Price |
$188
|
0.0%
|
$205
|
0.0%
|
$387
|
↑
0.8%
|
$234
|
0.0%
|
$0
|
0.0%
|
$149
|
0.0%
|
$205
|
0.0%
|
$268
|
0.0%
|
$210
|
0.0%
|
| Manufacturer | AMD | AMD | Intel | Intel | AMD | AMD | AMD | Intel | Intel |
| C/SC/T | 6 / 0 / 12 | 8 / 0 / 16 | 10 / 4 / 16 | 10 / 4 / 16 | 6 / 0 / 12 | 6 / 0 / 12 | 8 / 0 / 16 | 6 / 0 / 12 | 6 / 0 / 12 |
| L2 / L3 Cache | 1024.0 kB / 16.0 MB | 512.0 kB / 16.0 MB | 1280.0 kB / 20.0 MB | 1280.0 kB / 20.0 MB | 1024.0 kB / 32.0 MB | 1024.0 kB / 16.0 MB | 512.0 kB / 16.0 MB | 1280.0 kB / 18.0 MB | 1280.0 kB / 18.0 MB |
| Base / Boost | 4.30 GHz / 5.00 GHz | 3.80 GHz / 4.60 GHz | 2.50 GHz / 4.60 GHz | 2.50 GHz / 4.60 GHz | 3.70 GHz / 4.70 GHz | 4.20 GHz / 4.70 GHz | 3.70 GHz / 4.60 GHz | 3.30 GHz / 4.80 GHz | 3.00 GHz / 4.60 GHz |
| Memory | DDR5 / 5200 MT/s | DDR4 / 3200 MT/s | DDR4, DDR5 / 4800 MT/s | DDR4, DDR5 / 4800 MT/s | DDR5 / 5200 MT/s | DDR5 / 5200 MT/s | DDR4 / 3200 MT/s | DDR4, DDR5 / 4800 MT/s | DDR4, DDR5 / 4800 MT/s |
| Arch / Node | Phoenix / 4 nm | Cezanne / 7 nm | Raptor Lake-S / 10 nm | Raptor Lake-S / 10 nm | Raphael / 5 nm | Phoenix / 4 nm | Cezanne / 7 nm | Alder Lake-S / 10 nm | Alder Lake-S / 10 nm |
| TDP / Max | 65 W / 61 W | 65 W / 61 W | 65 W / 154 W | 65 W / 148 W | 65 W / 88 W | 65 W / 61 W | 65 W / 61 W | 65 W / 117 W | 65 W / 117 W |
| Socket | AM5 | AM4 | LGA 1700 | LGA 1700 | AM5 | AM5 | AM4 | LGA 1700 | LGA 1700 |
| Int. GPU | Radeon 760M | Radeon Vega 8 | UHD Graphics 730 | None | None | None | None | UHD Graphics 770 | UHD Graphics 770 |
CPU Performance in Rendering, Encoding and Compression-Decompression
| CPU (Desc) | CB24_MC (Desc) | CB24_SC (Desc) | CB24_rel (Desc) | Blender (Desc) | Encoding_AV1 (Desc) | Encoding_h265 (Desc) | 7-zip_Pack (Desc) | 7-zip_Unpack (Desc) | Performance (Desc) |
|---|---|---|---|---|---|---|---|---|---|
| 770 | 103 |
30.5%
|
27.6%
|
40.9%
|
40.0%
|
40.9%
|
35.0%
|
35.8%
|
|
| 804 | 90 |
31.8%
|
29.2%
|
42.7%
|
34.4%
|
38.2%
|
38.4%
|
35.8%
|
|
| 833 | 106 |
33.0%
|
29.8%
|
44.5%
|
36.8%
|
36.8%
|
28.9%
|
35.0%
|
|
| 833 | 106 |
33.0%
|
29.8%
|
44.5%
|
36.8%
|
36.8%
|
28.9%
|
35.0%
|
|
| 805 | 108 |
31.8%
|
26.7%
|
47.5%
|
39.5%
|
34.1%
|
29.9%
|
34.9%
|
|
| 739 | 102 |
29.2%
|
26.5%
|
40.5%
|
39.0%
|
38.6%
|
34.4%
|
34.7%
|
|
| 764 | 88 |
30.2%
|
24.4%
|
42.7%
|
33.6%
|
38.2%
|
34.7%
|
34.0%
|
|
| 741 | 105 |
29.3%
|
28.3%
|
47.5%
|
36.7%
|
34.1%
|
27.6%
|
33.9%
|
|
| 671 | 96 |
26.6%
|
27.6%
|
45.6%
|
35.1%
|
32.3%
|
26.5%
|
32.3%
|
Add Comment on AMD Ryzen 5 7400F