As an Amazon Associate I earn from qualifying purchases.
Compare Popular PC Parts by Performance and Price
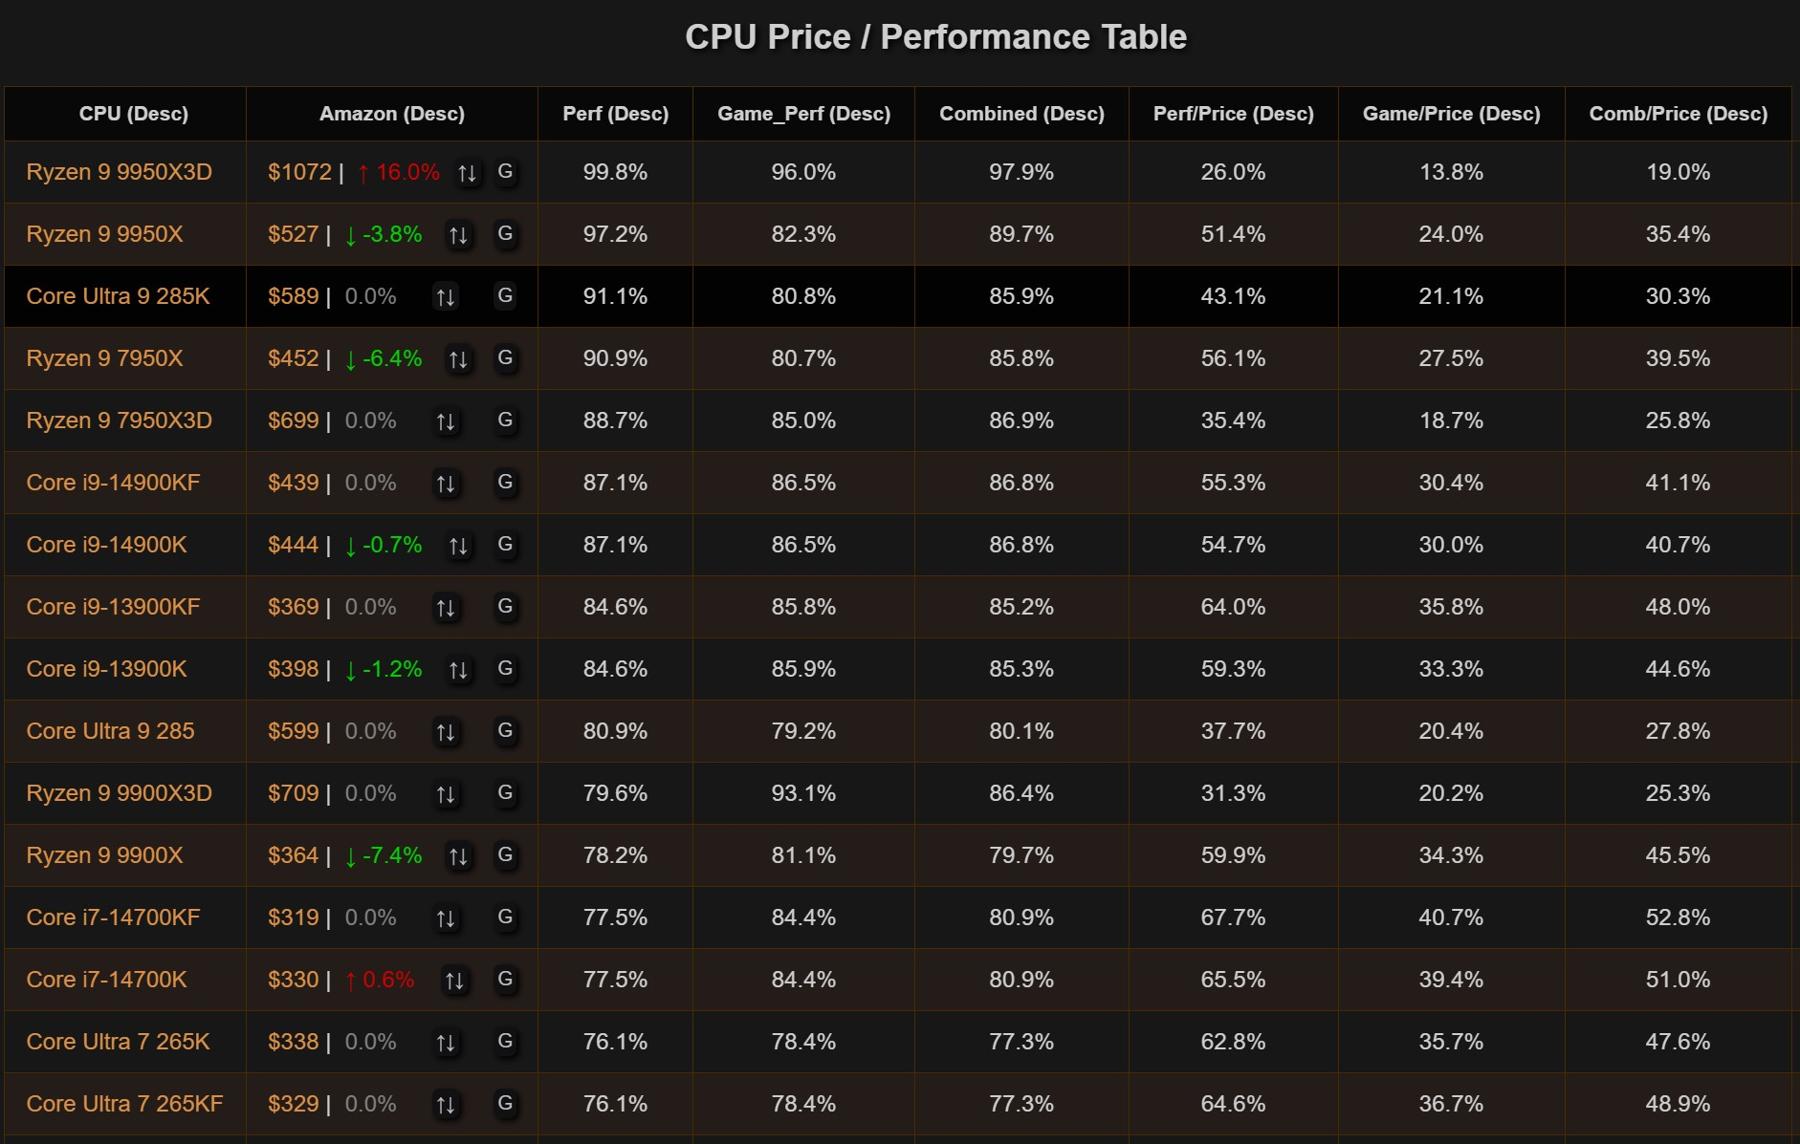
Best CPU by Relative Performance
| CPU | Application Perf | Price |
|---|---|---|
|
285.4%
|
$10000 | 0.0% | |
|
255.0%
|
$4399 | 0.0% | |
|
253.5%
|
$8788 | 0.0% | |
|
229.2%
|
$7399 | 0.0% | |
|
228.3%
|
$3950 | ↓ -0.7% | |
|
177.7%
|
$3899 | 0.0% | |
|
176.3%
|
$2260 | ↓ -1.7% | |
|
156.1%
|
$3800 | 0.0% | |
|
155.8%
|
$1900 | ↑ 5.6% | |
|
144.3%
|
$2700 | 0.0% |
Best CPU by Gaming Performance
| CPU | Gaming Perf | Price |
|---|---|---|
|
100.0%
|
$469 | ↑ 2.2% | |
|
98.8%
|
$439 | ↑ 4.5% | |
|
95.5%
|
$899 | 0.0% | |
|
94.9%
|
$680 | ↑ 6.2% | |
|
92.0%
|
$510 | 0.0% | |
|
89.1%
|
$377 | 0.0% | |
|
86.0%
|
$240 | ↑ 4.4% | |
|
84.0%
|
$398 | ↓ -43.9% | |
|
82.3%
|
$320 | 0.0% | |
|
82.3%
|
$425 | ↓ -44.1% |
Best CPU by Combined Performance
| CPU | Combined Perf | Price |
|---|---|---|
|
138.0%
|
$4399 | 0.0% | |
|
137.8%
|
$10000 | 0.0% | |
|
137.5%
|
$3950 | ↓ -0.7% | |
|
137.3%
|
$7399 | 0.0% | |
|
137.3%
|
$8788 | 0.0% | |
|
127.0%
|
$3899 | 0.0% | |
|
126.4%
|
$2260 | ↓ -1.7% | |
|
115.8%
|
$3800 | 0.0% | |
|
115.6%
|
$1900 | ↑ 5.6% | |
|
110.7%
|
$2700 | 0.0% |
🔥 Recently Discounted CPUs
| CPU | Application Perf | Price |
|---|
Best CPU by Performance Per Price
| CPU | Perf / Price | Price |
|---|---|---|
|
122.2%
|
$152 | ↓ -5.0% | |
|
113.5%
|
$200 | 0.0% | |
|
106.5%
|
$86 | 0.0% | |
|
103.2%
|
$220 | 0.0% | |
|
95.8%
|
$258 | ↑ 11.2% | |
|
94.8%
|
$196 | ↑ 8.8% | |
|
91.7%
|
$320 | 0.0% | |
|
87.4%
|
$240 | ↓ -36.0% | |
|
86.0%
|
$167 | ↓ -3.9% | |
|
85.7%
|
$168 | ↓ -10.9% |
Best CPU by Gaming Performance Per Price
| CPU | Game / Price | Price |
|---|---|---|
|
107.2%
|
$86 | 0.0% | |
|
94.2%
|
$152 | ↓ -5.0% | |
|
90.7%
|
$168 | ↓ -10.9% | |
|
87.4%
|
$167 | ↓ -1.8% | |
|
85.6%
|
$167 | ↓ -1.8% | |
|
82.8%
|
$167 | ↓ -3.9% | |
|
78.9%
|
$150 | 0.0% | |
|
77.8%
|
$140 | 0.0% | |
|
77.5%
|
$182 | ↑ 23.0% | |
|
77.3%
|
$145 | ↓ -1.5% |
Best GPU by Performance 1080p
| GPU | Gaming 1080p | Price |
|---|---|---|
|
103.1%
|
$10175 | 0.0% | |
|
100.0%
|
$4100 | ↑ 6.5% | |
|
88.5%
|
$3499 | 0.0% | |
|
76.9%
|
$1500 | 0.0% | |
|
74.6%
|
$1460 | ↓ -1.4% | |
|
73.9%
|
$1460 | ↓ -1.4% | |
|
70.0%
|
$1041 | ↓ -0.7% | |
|
69.2%
|
$770 | 0.0% | |
|
64.6%
|
$1300 | ↓ -6.8% | |
|
63.5%
|
$670 | 0.0% |
Best GPU by Performance Per Price
| GPU | Perf / Price | Price |
|---|---|---|
|
93.4%
|
$325 | 0.0% | |
|
89.4%
|
$200 | 0.0% | |
|
87.4%
|
$439 | 0.0% | |
|
87.2%
|
$450 | 0.0% | |
|
82.6%
|
$345 | 0.0% | |
|
80.3%
|
$400 | 0.0% | |
|
80.2%
|
$410 | 0.0% | |
|
80.2%
|
$130 | ↓ -43.5% | |
|
79.9%
|
$280 | 0.0% | |
|
79.6%
|
$350 | ↑ 0.0% |
🔥 Recently Discounted GPUs
| GPU | Gaming 1080p | Price |
|---|
🔥 Recently Discounted Graphics Cards
| GPU | Graphics Card | Gaming 1440p | Price |
|---|
Best GPU by Performance 1440p
| GPU | Gaming 1440p | Price |
|---|---|---|
|
106.1%
|
$10175 | 0.0% | |
|
100.0%
|
$4100 | ↑ 6.5% | |
|
82.9%
|
$3499 | 0.0% | |
|
72.0%
|
$1500 | 0.0% | |
|
67.1%
|
$1460 | ↓ -1.4% | |
|
66.8%
|
$1460 | ↓ -1.4% | |
|
64.0%
|
$1041 | ↓ -0.7% | |
|
62.3%
|
$770 | 0.0% | |
|
57.8%
|
$1300 | ↓ -6.8% | |
|
56.5%
|
$670 | 0.0% |
Best Monitor for Productivity
| Monitor | Productivity | Price |
|---|---|---|
|
100.5%
|
$930 | 0.0% | |
|
99.4%
|
$1100 | 0.0% | |
|
98.6%
|
$783 | ↓ -0.8% | |
|
97.8%
|
$699 | 0.0% | |
|
96.7%
|
$3394 | 0.0% | |
|
96.2%
|
$1785 | ↑ 0.4% | |
|
96.2%
|
$530 | 0.0% | |
|
95.3%
|
$903 | 0.0% | |
|
95.0%
|
$550 | ↓ 0.0% | |
|
94.8%
|
$1366 | 0.0% |
Best Monitor for Gaming
| Monitor | Game / Media | Price |
|---|---|---|
|
97.8%
|
$1249 | 0.0% | |
|
93.1%
|
$755 | ↑ 12.9% | |
|
93.1%
|
$900 | 0.0% | |
|
92.9%
|
$830 | ↓ -4.5% | |
|
92.6%
|
$963 | 0.0% | |
|
92.4%
|
$1157 | ↓ -5.2% | |
|
91.4%
|
$898 | ↑ 0.4% | |
|
91.4%
|
$930 | ↓ -1.3% | |
|
91.4%
|
$799 | 0.0% | |
|
90.9%
|
$600 | 0.0% |
Best Monitor Overall
| Monitor | Overall Quality | Price |
|---|---|---|
|
96.1%
|
$400 | 0.0% | |
|
95.4%
|
$1249 | 0.0% | |
|
94.4%
|
$389 | ↓ -1.3% | |
|
94.4%
|
$1450 | ↓ -23.9% | |
|
94.2%
|
$903 | 0.0% | |
|
93.6%
|
$755 | ↑ 12.9% | |
|
93.6%
|
$389 | ↑ 30.1% | |
|
93.6%
|
$900 | 0.0% | |
|
93.3%
|
$1500 | 0.0% | |
|
93.0%
|
$963 | 0.0% |
🔥 Recently Discounted Monitors
| Monitor | Overall Quality | Price |
|---|
Best Monitor by Work per Price
| Monitor | Work / Price | Price |
|---|---|---|
|
129.3%
|
$110 | 0.0% | |
|
128.0%
|
$70 | 0.0% | |
|
116.8%
|
$75 | 0.0% | |
|
109.4%
|
$85 | 0.0% | |
|
100.4%
|
$110 | 0.0% | |
|
97.8%
|
$110 | 0.0% | |
|
96.6%
|
$100 | 0.0% | |
|
92.3%
|
$99 | 0.0% | |
|
91.3%
|
$110 | 0.0% | |
|
91.0%
|
$100 | 0.0% |
Best Monitor by Game per Price
| Monitor | Gaming / Price | Price |
|---|---|---|
|
126.0%
|
$70 | 0.0% | |
|
116.3%
|
$75 | 0.0% | |
|
111.4%
|
$85 | 0.0% | |
|
103.6%
|
$110 | 0.0% | |
|
99.7%
|
$110 | 0.0% | |
|
97.7%
|
$100 | 0.0% | |
|
97.4%
|
$110 | 0.0% | |
|
96.6%
|
$99 | 0.0% | |
|
90.7%
|
$90 | 0.0% | |
|
90.4%
|
$110 | 0.0% |
Best Motherboard by Quality & Features
| Motherboard | Overall_Quality | Price |
|---|---|---|
| MSI MEG Z890 ACE |
105.6%
|
$460 | 0.0% |
| ASUS ROG MAXIMUS Z890 EXTREME |
105.6%
|
$920 | 0.0% |
| MSI MEG Z890 GODLIKE |
105.4%
|
$1055 | 0.0% |
| MSI MEG X870E GODLIKE |
105.4%
|
$796 | 0.0% |
| GIGABYTE Z890 AORUS Xtreme AI TOP |
105.0%
|
$700 | ↓ -1.1% |
| ASUS ROG Maximus Z890 Hero |
104.4%
|
$444 | ↓ -1.3% |
| ASUS ROG MAXIMUS Z890 HERO BTF |
104.2%
|
$942 | ↓ -3.7% |
| ROG MAXIMUS Z790 DARK HERO |
103.8%
|
$700 | ↑ 0.0% |
| ASUS ROG MAXIMUS Z890 APEX |
103.6%
|
$575 | ↑ 69.1% |
| ASUS ROG Crosshair X870E Hero |
103.4%
|
$547 | ↓ -2.0% |
Best Motherboard by Q & F Per Price
| Motherboard | Q & F / Price | Price |
|---|---|---|
| MSI PRO Z890-A WiFi |
139.3%
|
$120 | ↓ -7.0% |
| MSI PRO Z790-A MAX WiFi |
130.8%
|
$123 | ↓ -59.0% |
| MSI PRO B650-A WiFi |
129.6%
|
$110 | ↓ -45.0% |
| MSI X670E GAMING PLUS WIFI |
123.1%
|
$110 | ↓ -57.5% |
| MSI MPG Z790 Edge WiFi |
114.4%
|
$148 | 0.0% |
| ASUS Prime B840-PLUS WiFi |
110.2%
|
$101 | ↓ -36.1% |
| ASUS TUF Gaming X670E-PLUS WiFi |
109.5%
|
$145 | ↑ 30.6% |
| MSI MAG X670E Tomahawk WiFi |
108.4%
|
$140 | ↓ -1.8% |
| ASRock AMD B850 LiveMixer WiFi 7 |
107.8%
|
$139 | ↓ -3.3% |
| MSI PRO B550M-VC WiFi |
106.2%
|
$95 | ↑ 18.4% |
🔥 Recently Discounted Motherboards
| Motherboard | Overall_Quality | Price |
|---|
Best Motherboard by Power Design
| Motherboard | CPU_Phases | Price |
|---|---|---|
| Asus Pro WS TRX50-SAGE WIFI | 36 / 90 A | $894 | 0.0% |
| Asus Pro WS WRX90E-SAGE SE | 32 / 110 A | $964 | ↓ -22.7% |
| MSI MEG Z890 GODLIKE | 26 / 110 A | $1055 | 0.0% |
| MSI MEG Z890 ACE | 24 / 110 A | $460 | 0.0% |
| ASRock AMD X870E Taichi Lite | 24 / 110 A | $300 | 0.0% |
| MSI MEG X870E GODLIKE | 24 / 110 A | $796 | 0.0% |
| ASUS ROG MAXIMUS Z890 EXTREME | 24 / 110 A | $920 | 0.0% |
| ASRock AMD X870E Taichi | 24 / 110 A | $330 | 0.0% |
| ASUS ROG MAXIMUS Z890 APEX | 22 / 110 A | $575 | ↑ 69.1% |
| GIGABYTE Z890 AORUS Xtreme AI TOP | 22 / 110 A | $700 | ↓ -1.1% |
Best Micro-ATX Motherboard by Q & F
| Micro-ATX Motherboard | Overall_Quality | Price |
|---|---|---|
| ASUS TUF Gaming B850M-PLUS WiFi |
73.6%
|
$250 | ↑ 20.3% |
| ASUS ROG Strix B850-G Gaming WiFi |
71.8%
|
$260 | ↑ 26.8% |
| ASUS Prime Z890M-PLUS WiFi |
71.2%
|
$193 | ↓ -4.6% |
| MSI MAG B850M Mortar WiFi |
70.6%
|
$220 | 0.0% |
| B850M AORUS ELITE WIFI6E ICE (Rev. 1.x) |
68.4%
|
$170 | 0.0% |
| ASRock Z890M Riptide WiFi 6E Phantom |
68.4%
|
$180 | 0.0% |
| MSI MAG B650M MORTAR WIFI |
67.2%
|
$248 | ↓ -2.4% |
| MSI PRO B860M-A WiFi |
65.8%
|
$179 | ↑ 5.6% |
| Pro WS B850M-ACE SE |
64.0%
|
$324 | ↓ -10.0% |
| ASUS TUF Gaming B860M-PLUS WiFi |
62.2%
|
$201 | ↑ 0.5% |
Best Mini-ITX Motherboard by Q & F
| Mini-ITX Motherboard | Overall_Quality | Price |
|---|---|---|
| ASRock Phantom Gaming Z890i Nova WiFi |
76.4%
|
$250 | 0.0% |
| ASUS ROG STRIX X870-I GAMING WIFI |
76.2%
|
$416 | 0.0% |
| MSI MPG Z890I Edge TI |
75.8%
|
$300 | 0.0% |
| MPG X870I EDGE TI EVO WIFI |
74.4%
|
$400 | 0.0% |
| GIGABYTE X870I AORUS PRO ICE |
66.8%
|
$290 | 0.0% |
| ASUS ROG Strix B650E-I Gaming |
65.2%
|
$452 | 0.0% |
| ASUS ROG Strix B850-I Gaming WiFi |
64.8%
|
$326 | ↑ 23.0% |
| ASUS ROG STRIX B860-I GAMING WIFI |
64.6%
|
$208 | 0.0% |
| GIGABYTE B650I AORUS Ultra Mini-ITX |
63.8%
|
$180 | 0.0% |
| MSI MPG B850I Edge TI WiFi |
62.6%
|
$264 | ↓ -0.2% |
Best RAM Memory by Performance
| RAM Memory | Performance | Price |
|---|---|---|
|
100.3%
|
$800 | 0.0% | |
|
100.3%
|
$700 | 0.0% | |
|
100.3%
|
$800 | 0.0% | |
|
100.3%
|
$750 | 0.0% | |
|
100.3%
|
$800 | 0.0% | |
|
100.3%
|
$1400 | 0.0% | |
|
100.3%
|
$700 | 0.0% | |
|
100.3%
|
$1300 | 0.0% | |
|
100.3%
|
$800 | 0.0% | |
|
100.3%
|
$1300 | 0.0% |
Best RAM Memory by Performance Per Price
| RAM Memory | Performance / Price | Price |
|---|---|---|
|
103.8%
|
$259 | ↓ -19.1% | |
|
101.8%
|
$233 | ↑ 0.3% | |
|
96.5%
|
$239 | ↓ -11.4% | |
|
84.6%
|
$350 | ↑ 2.9% | |
|
78.3%
|
$378 | ↑ 2.5% | |
|
72.5%
|
$424 | 0.0% | |
|
71.8%
|
$441 | 0.0% | |
|
71.8%
|
$441 | 0.0% | |
|
71.4%
|
$402 | 0.0% | |
|
71.4%
|
$402 | 0.0% |
Best RAM by Combined Performance per Price
| RAM Memory | Combined / Price | Price |
|---|---|---|
|
227.1%
|
$259 | ↓ -19.1% | |
|
186.5%
|
$518 | 0.0% | |
|
129.8%
|
$518 | 0.0% | |
|
124.3%
|
$518 | 0.0% | |
|
97.3%
|
$518 | 0.0% | |
|
93.3%
|
$518 | 0.0% | |
|
84.2%
|
$480 | 0.0% | |
|
79.3%
|
$424 | 0.0% | |
|
78.7%
|
$660 | ↓ -10.8% | |
|
78.5%
|
$441 | 0.0% |
🔥 Recently Discounted RAM
| RAM Memory | Performance | Price |
|---|
Best NVMe SSD by Performance
| NVMe SSD | Performance | Price |
|---|---|---|
|
99.1%
|
$2290 | ↑ 14.5% | |
|
96.7%
|
$689 | ↓ -12.8% | |
|
96.5%
|
$895 | ↓ -18.6% | |
|
96.5%
|
$1103 | ↑ 0.3% | |
|
95.5%
|
$629 | ↓ -1.7% | |
|
95.5%
|
$450 | ↑ 0.7% | |
|
94.3%
|
$356 | ↓ -9.5% | |
|
94.1%
|
$533 | ↑ 7.7% | |
|
93.7%
|
$683 | 0.0% | |
|
93.7%
|
$427 | ↓ -5.1% |
Best NVMe SSD by Performance Per Price
| NVMe SSD | Performance / Price | Price |
|---|---|---|
|
77.2%
|
$102 | 0.0% | |
|
70.8%
|
$102 | 0.0% | |
|
65.8%
|
$110 | 0.0% | |
|
65.6%
|
$109 | ↓ -8.4% | |
|
63.7%
|
$103 | 0.0% | |
|
58.3%
|
$134 | ↓ -2.2% | |
|
53.3%
|
$175 | 0.0% | |
|
50.6%
|
$190 | ↑ 5.6% | |
|
47.8%
|
$165 | 0.0% | |
|
47.7%
|
$155 | ↓ -3.1% |
Best NVMe SSD by Combined Performance per Price
| NVMe SSD | Combined / Price | Price |
|---|---|---|
|
143.7%
|
$228 | 0.0% | |
|
109.8%
|
$290 | ↓ -39.6% | |
|
86.1%
|
$482 | 0.0% | |
|
70.4%
|
$629 | ↓ -1.7% | |
|
67.1%
|
$486 | 0.0% | |
|
66.0%
|
$465 | ↓ -1.1% | |
|
65.7%
|
$450 | 0.0% | |
|
65.1%
|
$689 | ↓ -12.8% | |
|
64.8%
|
$250 | 0.0% | |
|
64.3%
|
$254 | ↓ -11.4% |
🔥 Recently Discounted NVMe SSDs
| NVMe SSD | Performance | Price |
|---|
Best Power Supply by Performance
| Power Supply | Performance | Price |
|---|---|---|
|
99.0%
|
$677 | ↑ 1.9% | |
|
99.0%
|
$560 | 0.0% | |
|
98.3%
|
$427 | ↓ -13.8% | |
|
92.9%
|
$459 | ↓ -0.4% | |
|
92.2%
|
$175 | ↓ -1.3% | |
|
91.1%
|
$350 | ↑ 4.7% | |
|
91.1%
|
$336 | ↑ 1.2% | |
|
90.2%
|
$320 | 0.0% | |
|
89.5%
|
$250 | ↑ 10.6% | |
|
87.0%
|
$211 | ↓ -2.7% |
Best Power Supply by Performance Per Price
| Power Supply | Perf / Price | Price |
|---|---|---|
|
131.3%
|
$40 | 0.0% | |
|
128.6%
|
$43 | 0.0% | |
|
105.8%
|
$52 | 0.0% | |
|
96.6%
|
$60 | 0.0% | |
|
95.7%
|
$60 | ↓ -0.4% | |
|
94.6%
|
$80 | 0.0% | |
|
88.0%
|
$65 | 0.0% | |
|
86.3%
|
$90 | 0.0% | |
|
86.0%
|
$87 | 0.0% | |
|
85.4%
|
$90 | 0.0% |
🔥 Recently Discounted PSUs
| Power Supply | Performance | Price |
|---|
Best PC Case by Quality and Features
| PC Case | Quality & Features | Price |
|---|---|---|
|
108.0 pts
|
$550 | 0.0% | |
|
104.0 pts
|
$520 | 0.0% | |
|
104.0 pts
|
$530 | 0.0% | |
|
104.0 pts
|
$520 | 0.0% | |
|
104.0 pts
|
$190 | 0.0% | |
|
104.0 pts
|
$240 | 0.0% | |
|
104.0 pts
|
$230 | ↑ 15.1% | |
|
102.0 pts
|
$180 | 0.0% | |
|
102.0 pts
|
$263 | 0.0% | |
|
102.0 pts
|
$180 | 0.0% |
Best PC Case by Q & F Per Price
| PC Case | Q & F / Price | Price |
|---|---|---|
|
123.8%
|
$40 | 0.0% | |
|
114.3%
|
$63 | ↓ -10.0% | |
|
113.3%
|
$58 | 0.0% | |
|
111.0%
|
$60 | 0.0% | |
|
109.7%
|
$55 | 0.0% | |
|
108.0%
|
$70 | 0.0% | |
|
99.0%
|
$70 | 0.0% | |
|
94.5%
|
$80 | 0.0% | |
|
94.5%
|
$80 | 0.0% | |
|
93.9%
|
$70 | 0.0% |
🔥 Recently Discounted PC Cases
| PC Case | Quality & Features | Price |
|---|
Best Mini-Tower Case by Quality and Features
| Mini-Tower Case | Quality & Features | Price |
|---|---|---|
|
69.0%
|
$165 | 0.0% | |
|
68.0%
|
$120 | 0.0% | |
|
68.0%
|
$140 | 0.0% | |
|
68.0%
|
$130 | ↑ 8.3% | |
|
64.0%
|
$220 | 0.0% | |
|
58.0%
|
$120 | 0.0% | |
|
58.0%
|
$130 | 0.0% | |
|
57.0%
|
$130 | 0.0% | |
|
56.0%
|
$337 | 0.0% | |
|
54.0%
|
$140 | 0.0% |
Best Micro-Tower Case by Quality and Features
| Micro-Tower Case | Quality & Features | Price |
|---|---|---|
|
79.0%
|
$108 | ↓ -10.4% | |
|
78.0%
|
$146 | ↑ 4.3% | |
|
78.0%
|
$146 | 0.0% | |
|
78.0%
|
$167 | ↑ 0.0% | |
|
78.0%
|
$140 | 0.0% | |
|
78.0%
|
$170 | 0.0% | |
|
78.0%
|
$150 | ↑ 25.0% | |
|
78.0%
|
$135 | ↑ 15.8% | |
|
78.0%
|
$150 | 0.0% | |
|
74.0%
|
$80 | 0.0% |
Best Air CPU Cooler by Performance
| Air CPU Cooler | Performance | Price |
|---|---|---|
|
86.4%
|
$175 | 0.0% | |
|
86.4%
|
$165 | 0.0% | |
|
86.0%
|
$82 | 0.0% | |
|
86.0%
|
$56 | 0.0% | |
|
86.0%
|
$57 | 0.0% | |
|
86.0%
|
$47 | 0.0% | |
|
86.0%
|
$82 | 0.0% | |
|
84.0%
|
$36 | 0.0% | |
|
83.5%
|
$36 | 0.0% | |
|
83.5%
|
$36 | 0.0% |
Best Liquid CPU Cooler by Performance
| Liquid CPU Cooler | Performance | Price |
|---|---|---|
|
100.0%
|
$93 | 0.0% | |
|
100.0%
|
$84 | 0.0% | |
|
100.0%
|
$150 | 0.0% | |
|
99.2%
|
$230 | 0.0% | |
|
99.0%
|
$220 | ↑ 12.8% | |
|
99.0%
|
$160 | 0.0% | |
|
98.0%
|
$119 | 0.0% | |
|
98.0%
|
$183 | ↓ -20.0% | |
|
98.0%
|
$208 | ↓ -10.0% | |
|
98.0%
|
$119 | 0.0% |
Best CPU Cooler by Performance per Price
| CPU Cooler | Performance / Price | Price |
|---|---|---|
|
181.9%
|
$18 | 0.0% | |
|
157.3%
|
$18 | 0.0% | |
|
157.3%
|
$18 | 0.0% | |
|
157.0%
|
$20 | 0.0% | |
|
153.0%
|
$19 | 0.0% | |
|
153.0%
|
$19 | 0.0% | |
|
151.7%
|
$21 | 0.0% | |
|
151.3%
|
$19 | 0.0% | |
|
149.0%
|
$19 | 0.0% | |
|
146.0%
|
$19 | 0.0% |
🔥 Recently Discounted CPU Coolers
| CPU Cooler | Performance | Price |
|---|
Top Blog Posts:
- @Ivica
- 9 months ago
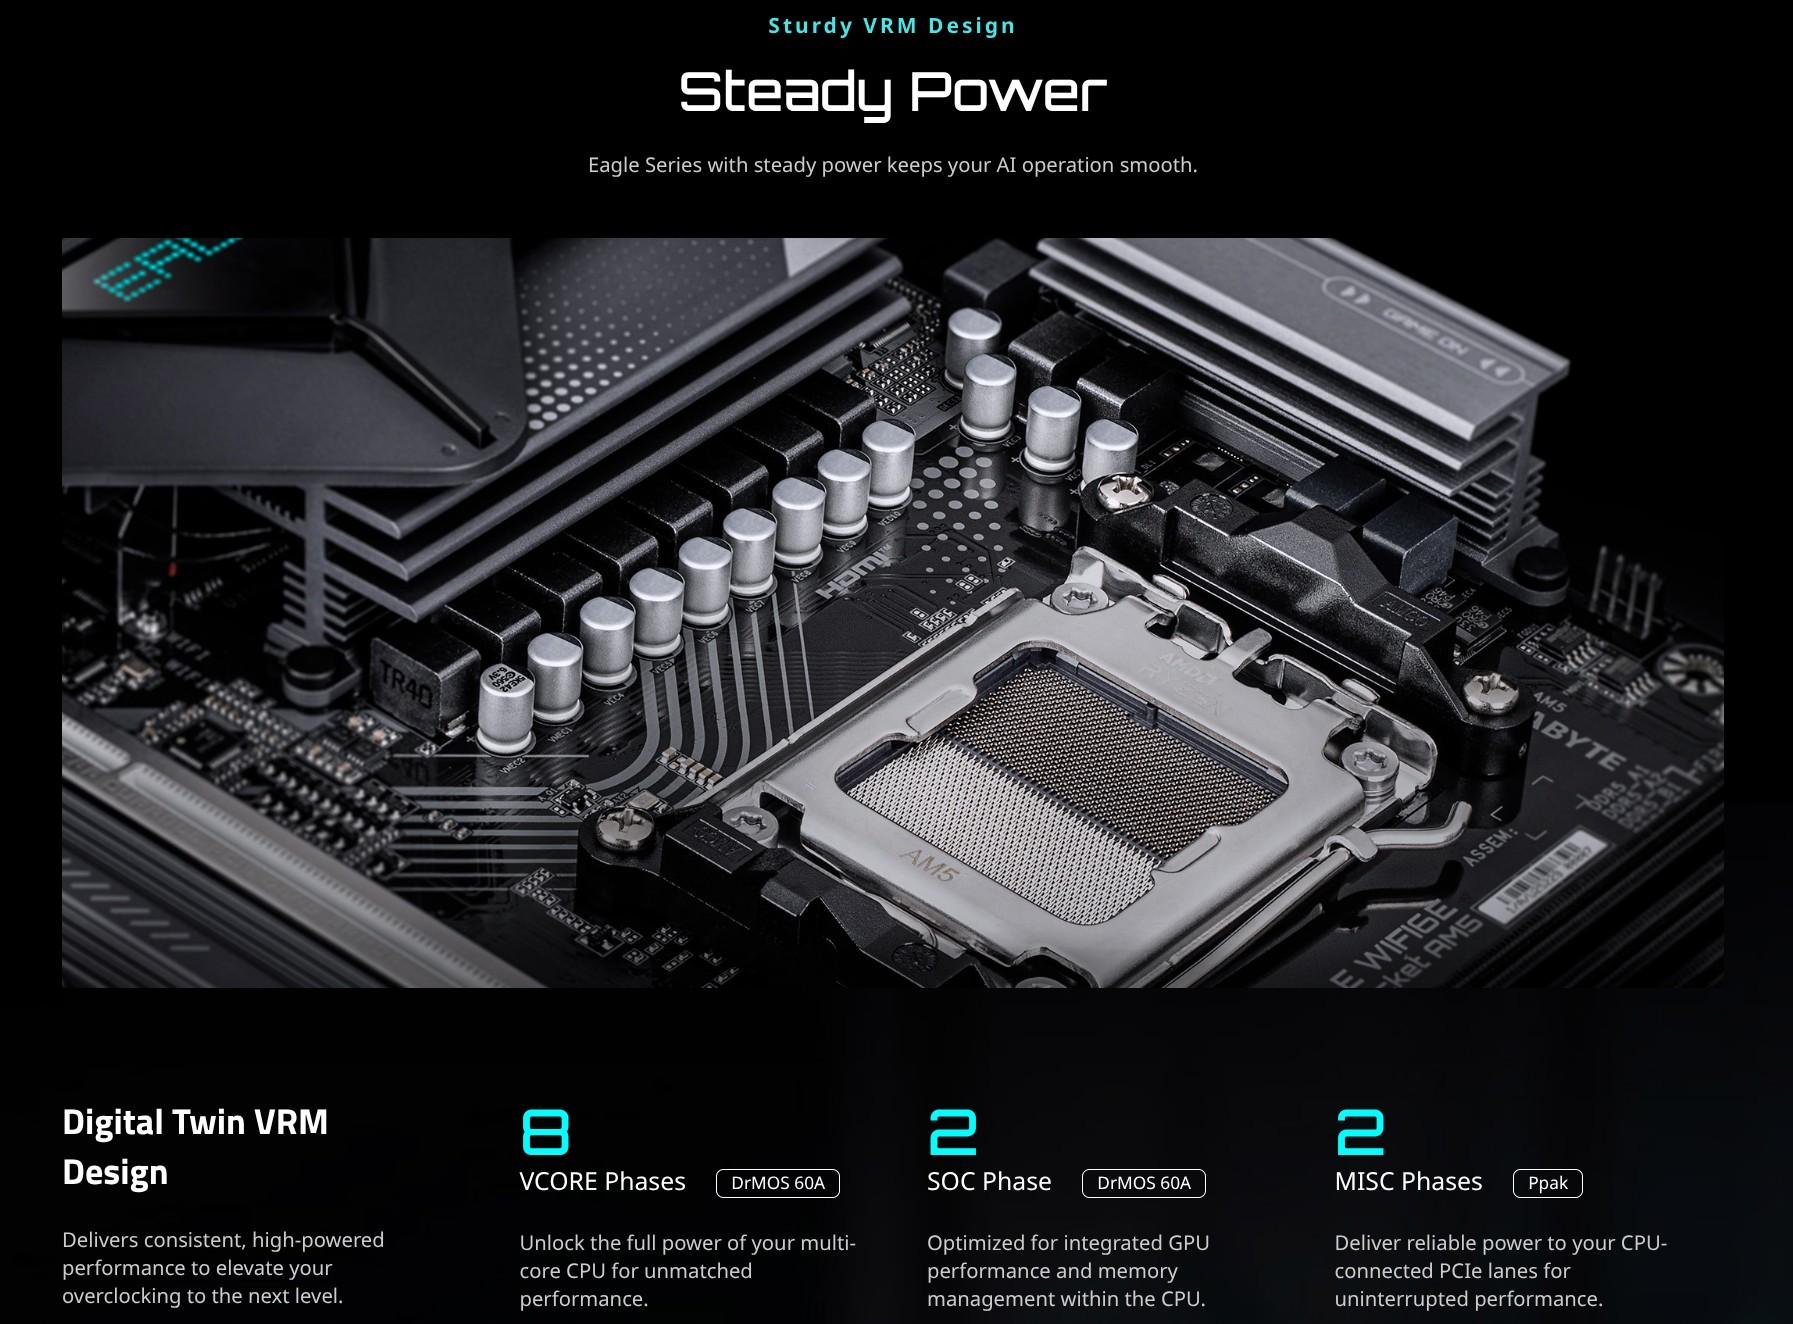
When you compare motherboards, you’ll often see marketing claims like “16-phase VRM” or “20+1 power stage design.” At first glance, it might seem like a bigger number is always better — but the truth is more complicated. To understand why some boards deliver cleaner, more stable power than others, you need to know the difference between real phases and doubled phases.
Topic: Motherboard Reviews.- @Ivica
- 11 months ago
While competitively priced at $250, price/performance ratio lags behind alternatives like the RTX 5060 and RX 9060 XT.
Topic: GPU Reviews.- @Ivica
- 11 months ago

The Radeon RX 9060 XT brings meaningful generational improvements, especially in ray tracing and AI-based upscaling. With a competitive price (if it holds), future-ready features, and excellent 1080p and 1440p performance, it's a solid pick for gamers looking to upgrade without going overboard.
Topic: GPU Reviews.- @Ivica
- 1 year ago
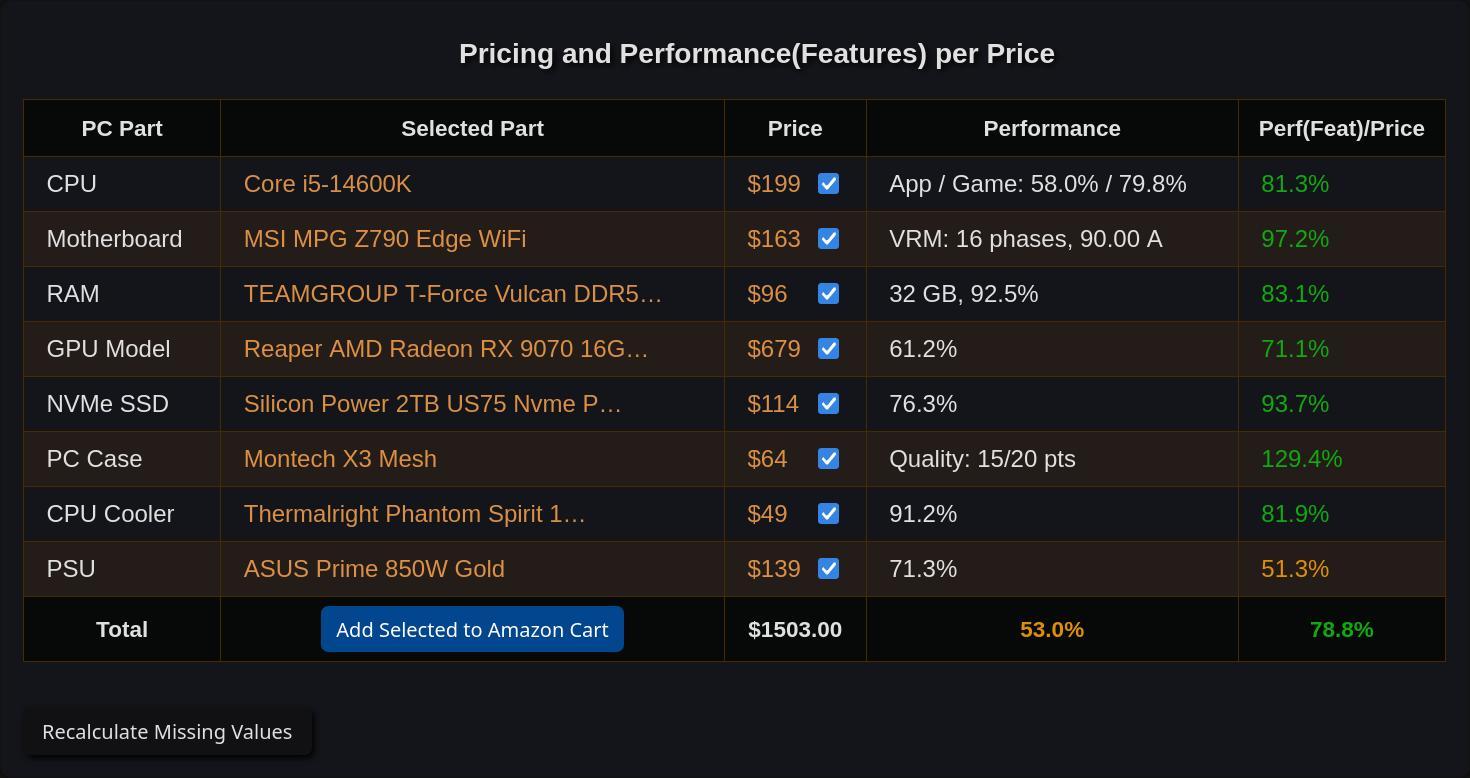
Best All-Rounder PC Build Under $1500 – Gaming & Productivity Ready
Topic: Best Midrange Builds.- @Ivica
- 1 year ago
Complete 2025 CPU guide: best processors for gaming, workstation, and budget builds. Detailed benchmarks, charts, and performance comparisons.
Topic: CPU Reviews.- @Ivica
- 1 year ago
The RTX 5060 Ti 16GB is a capable and forward-looking GPU for 1080p and 1440p gaming, with strong AI-powered features like DLSS 4. However, pricing and competition (especially from AMD and the RTX 5070) make it a harder sell.
Topic: GPU Reviews.- @Ivica
- 1 year ago
The AMD Ryzen 9 9950X3D delivers exceptional performance in both gaming and applications, leveraging its 3D V-Cache and Zen 5 architecture. While it commands a premium price, it offers top-tier performance, especially in CPU-limited gaming scenarios. Its efficiency and thermal performance are also noteworthy, making it a strong contender for high-end builds.
Topic: CPU Reviews.- @Ivica
- 1 year ago
PCSpecChart is a website designed for comparing the performance, specifications, and pricing of PC parts.
Topic: Website News.Highlights:
- @Ivica
- 1 year ago
The AMD Radeon RX 9070 XT offers strong 1440p and capable 4K gaming performance at a competitive MSRP. Its improved ray tracing capabilities and ample 16GB VRAM make it a compelling option. However, its success hinges on availability and pricing stability, especially compared to NVIDIA's offerings.
Topic: GPU Reviews.- @Ivica
- 1 year ago
The RTX 5080 is a strong contender for high-resolution gaming, especially with its AI-driven features like DLSS 4 and MFG. However, its traditional rendering performance is only marginally better than the RTX 4080 Super.
Topic: GPU Reviews.- @Ivica
- 1 year ago
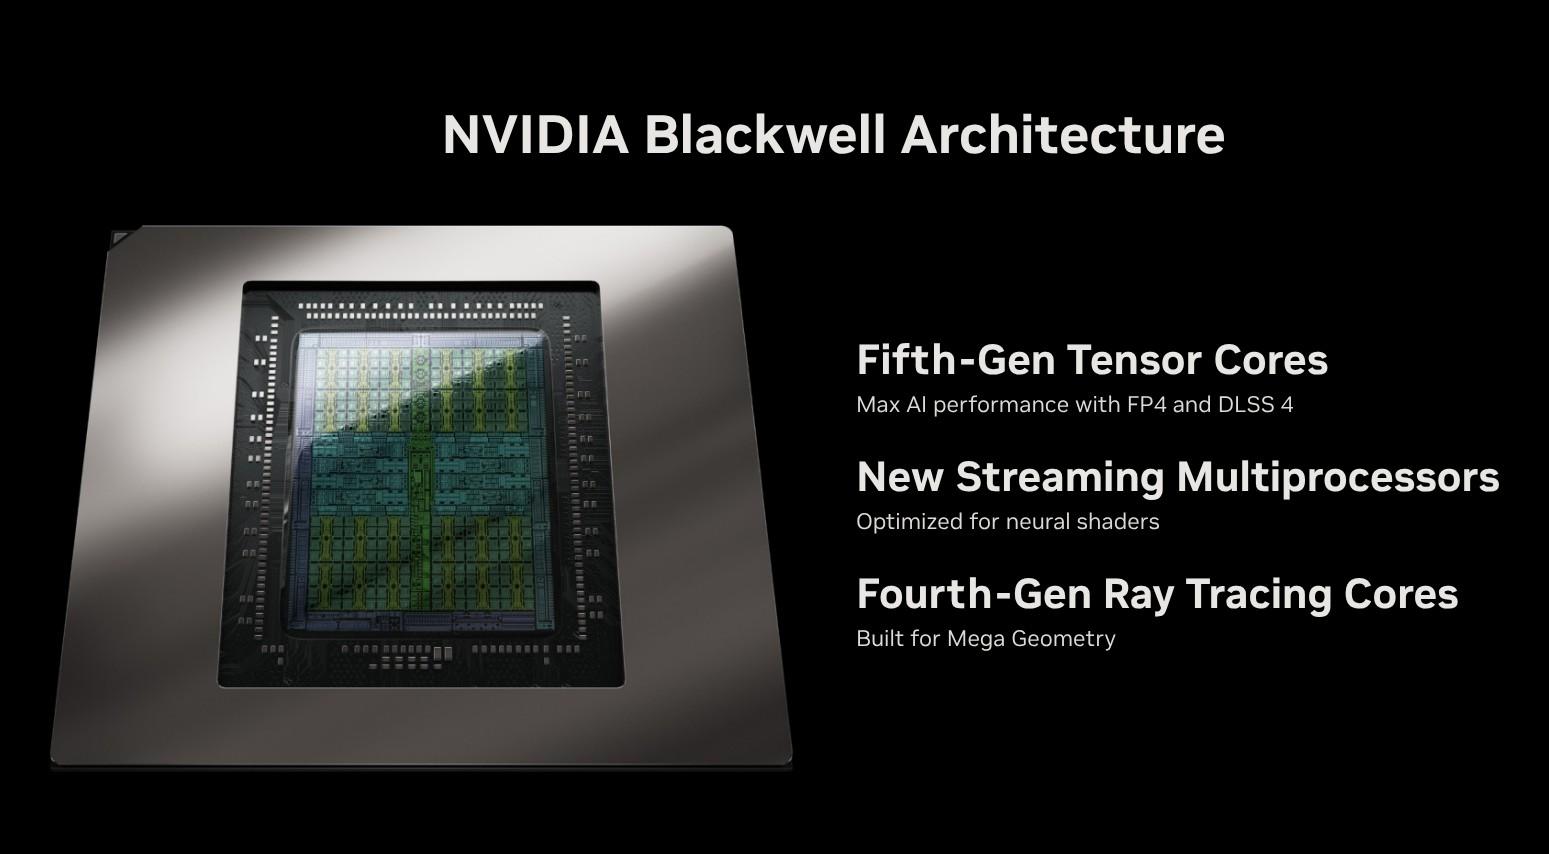
The NVIDIA GeForce RTX 5090, part of the Blackwell RTX 50 series, is NVIDIA's latest flagship GPU, setting a new benchmark for performance in gaming, AI, and content creation.
Topic: GPU Reviews.Blog Posts:
- @Ivica
- 1 year ago
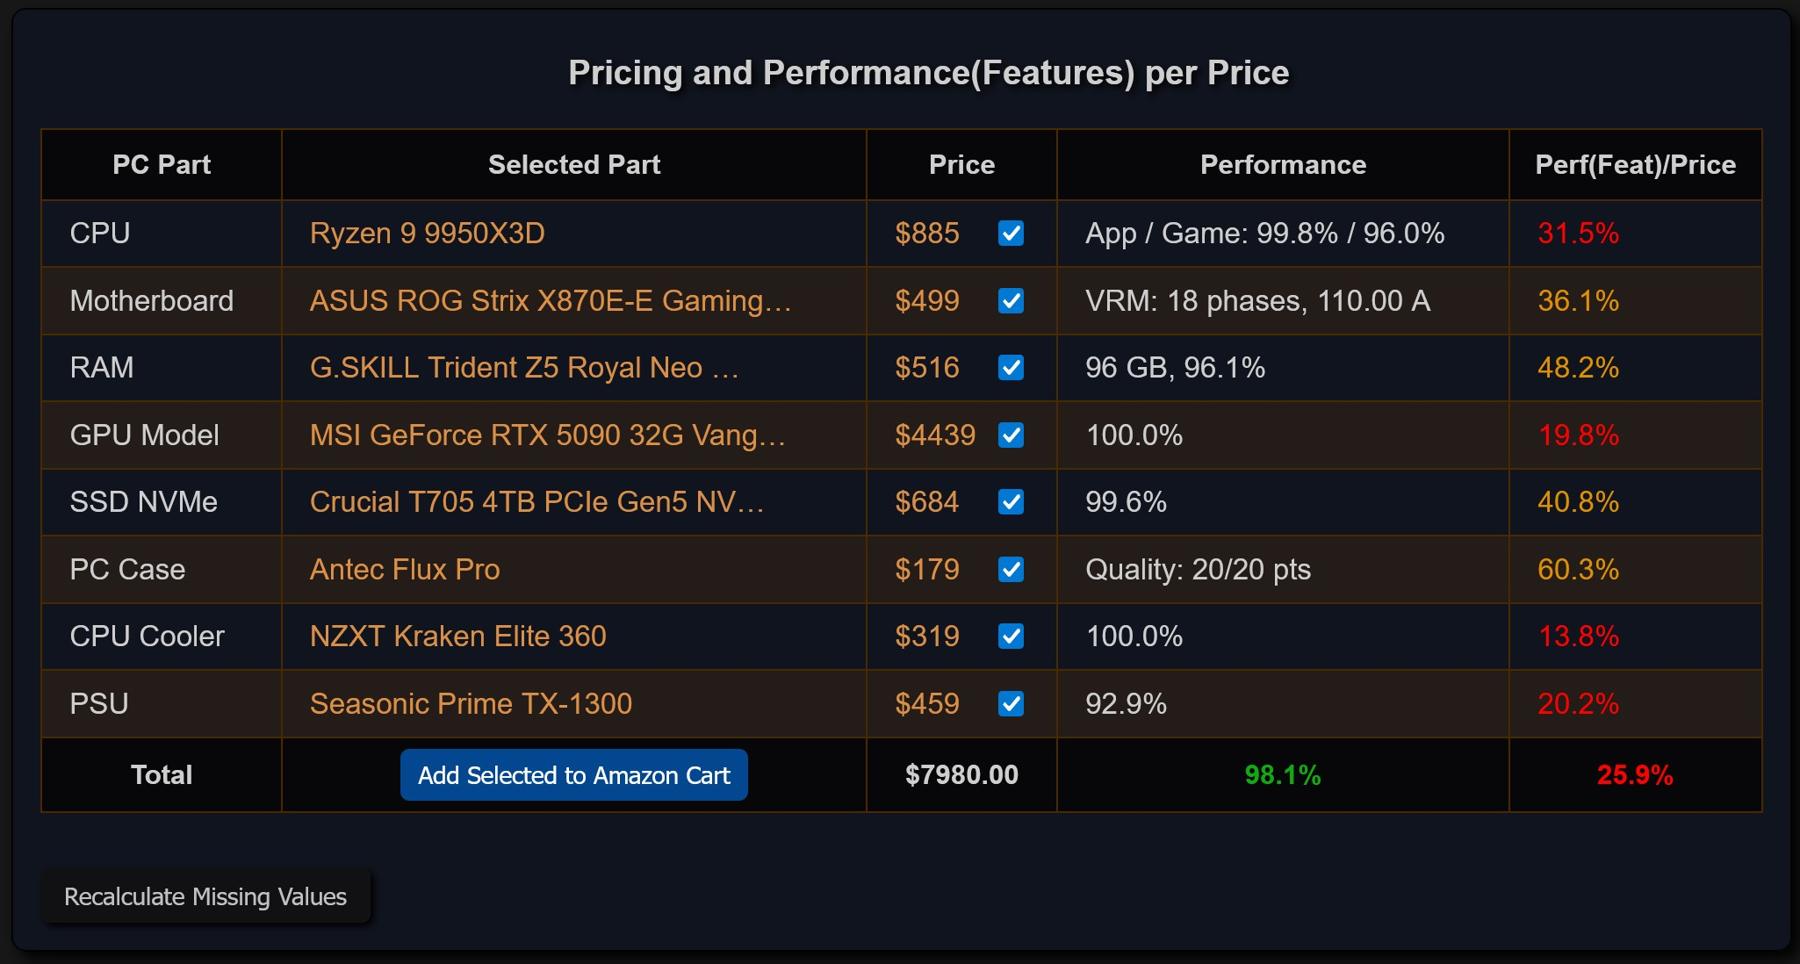
Building the ULTIMATE Dream PC for Spring 2025 – $8000+ RTX 5090 + Ryzen 9 9950X3D Beast!
Topic: Best High-End Builds.- @Ivica
- 1 year ago
The AMD Ryzen 9 9900X3D delivers very good performance in both gaming and applications, leveraging its 3D V-Cache and Zen 5 architecture. Compared to the currently overpriced 9950X3D, the 9900X3D offers a reasonable balance between gaming and application performance.
Topic: CPU Reviews.- @Ivica
- 1 year ago
The AMD RX 9070 is a strong 1440p and capable 4K gaming card, but its value is diminished by the existence of the RX 9070 XT. Its 16GB VRAM and improved ray tracing performance make it a competitive option against the RTX 5070, especially at 4K. However, the RX 9070 XT is generally considered the better purchase if you don't care about power effic…
Topic: GPU Reviews.- @Ivica
- 1 year ago
The RTX 5070 provides a noticeable performance uplift over the RTX 4070, particularly in ray tracing and DLSS 4 enabled titles.
Topic: GPU Reviews.- @Ivica
- 1 year ago
The RTX 5070 Ti delivers solid performance improvements, especially in ray tracing and with DLSS 4. Its value, however, is heavily dependent on whether it can be purchased at or near its MSRP.
Topic: GPU Reviews.Recent Comments:
The RTX 6000 (Blackwell) is currently the fastest GPU available for 4K performance and compute-heavy tasks, outperforming even the RTX 5090 by around 10% in ultra-high-resolution scenarios. Howeve…
The RTX 5090 leads the GPU market with unmatched raw power, cutting-edge ray tracing capabilities, and AI-enhanced performance via DLSS. It’s the most powerful consumer graphics card available, id…
Welcome to PCSpecChart!
I’m thrilled to have you here! Whether you’re building a new PC, upgrading your current setup, or simply exploring the world of PC components, I hope you find…